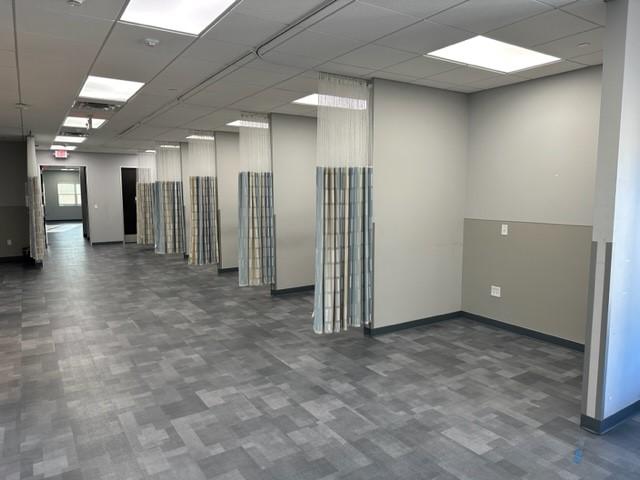
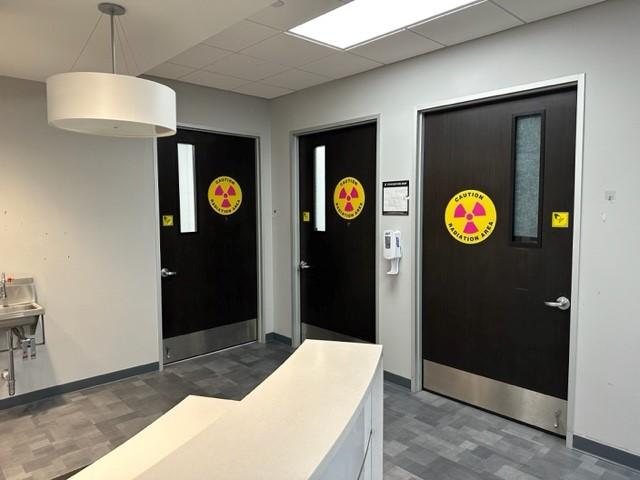
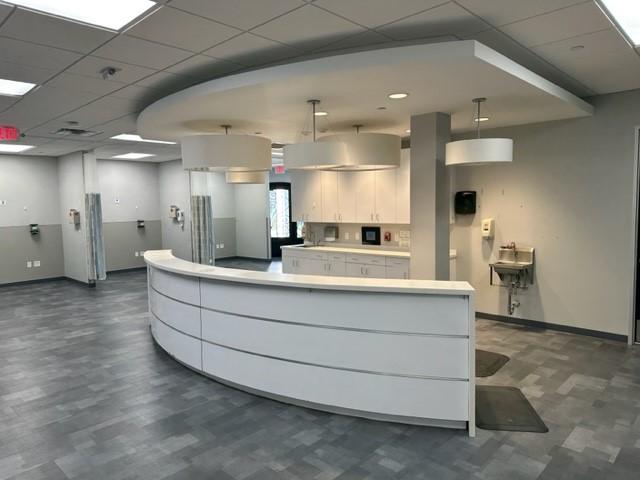
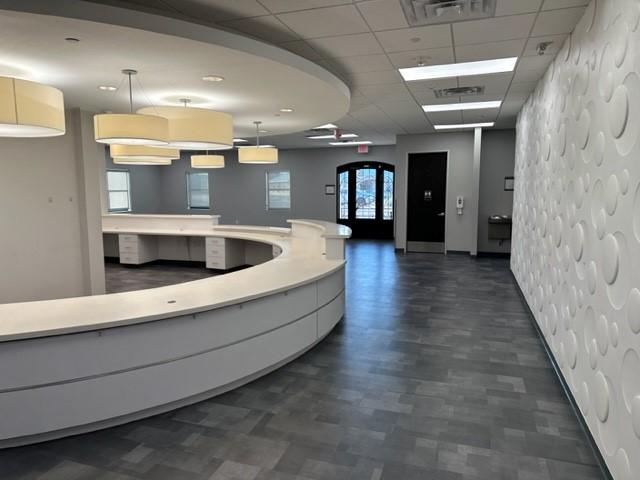
1-Mile | 3-Miles | 5-Miles | ||
---|---|---|---|---|
Total Population | 14,018 | 149,906 | 352,169 | |
Population Median Age | 31 | 35 | 36 | |
Population by Age | 0-9 Yrs | 2536 (18%) | 19413 (12%) | 44236 (12%) |
10-19 Yrs | 1086 (7%) | 15880 (10%) | 43964 (12%) | |
20-29 Yrs | 3811 (27%) | 34789 (23%) | 70154 (19%) | |
30-39 Yrs | 2706 (19%) | 24561 (16%) | 54502 (15%) | |
40-49 Yrs | 1397 (9%) | 16070 (10%) | 40943 (11%) | |
50-59 Yrs | 860 (6%) | 14009 (9%) | 37144 (10%) | |
60-69 Yrs | 686 (4%) | 12238 (8%) | 30870 (8%) | |
70+ Yrs | 935 (6%) | 12945 (8%) | 30356 (8%) | |
Median HH Income | $56,293 | $54,629 | $57,359 | |
Total Household Income | < 24K | 1261 (21%) | 12219 (20%) | 27311 (20%) |
25-49K | 1260 (21%) | 15076 (25%) | 29729 (22%) | |
50-74K | 1377 (23%) | 11367 (19%) | 24641 (18%) | |
75-99K | 987 (16%) | 7172 (12%) | 15872 (12%) | |
100-199K | 794 (13%) | 10902 (18%) | 26941 (20%) | |
200K+ | 204 (3%) | 2550 (4%) | 6635 (5%) | |
Highest Education Level | No Diploma | 783 | 8417 | 22518 |
Diploma or GED | 1476 | 18383 | 46322 | |
Some College | 1459 | 23106 | 54761 | |
Assoc. Degree | 640 | 8345 | 19385 | |
Bachelors Degree | 2543 | 24989 | 53675 | |
Higher Degree | 2305 | 15929 | 34098 | |
Total Housing Units | 6,801 | 65,590 | 143,339 | |
--Owner-Occupied | 805 | 21,859 | 60,508 | |
--Renter-Occupied | 5,079 | 37,427 | 70,621 | |
Owner-Occupied Values | < 100K | 13 | 1455 | 4616 |
100-199K | 419 | 9500 | 25859 | |
200-299K | 220 | 7225 | 19033 | |
300-399K | 70 | 2410 | 6877 | |
400-499K | 25 | 576 | 1445 | |
500K+ | 59 | 692 | 2678 | |
Total Working Age Population | 10,682 | 121,019 | 283,442 | |
In Work Force | 7,949 | 84,365 | 193,551 | |
Not In Work Force | 2,733 | 36,654 | 89,891 | |
Workforce Employed | 7,632 | 79,837 | 182,505 | |
Workforce Unemployed | 292 | 4,017 | 9,825 | |
Civlian Workforce | 7,924 | 83,855 | 192,331 | |
Military Workforce | 25 | 510 | 1,221 | |
Total Households | 5,884 | 59,285 | 131,128 | |
Family Households | 2,592 | 30,397 | 74,557 | |
Non-Family Households | 3,293 | 28,889 | 56,571 | |
Married Couple | 1,716 | 19,852 | 50,950 | |
Other Family | 876 | 10,544 | 23,608 | |
Married w/Child | 1,011 | 8,234 | 21,479 | |
Single Male w/Child | 127 | 1,164 | 2,601 | |
Single Female w/Child | 437 | 4,019 | 8,909 |
Population Change Last Two Decades - Plus Projection
2000 | % | 2010 | % | 2020 | % | 2030 | |
---|---|---|---|---|---|---|---|
Texas | 20,851,820 | +21 | 25,145,561 | +18 | 29,677,668 | +18 | 34,894,452 |
Bexar County | 1,392,931 | +23 | 1,714,773 | +22 | 2,093,502 | +20 | 2,502,617 |
Total Working Age Population:
Total Households:
Total Working Age Population:
Total Households:
Total Working Age Population:
Total Households: