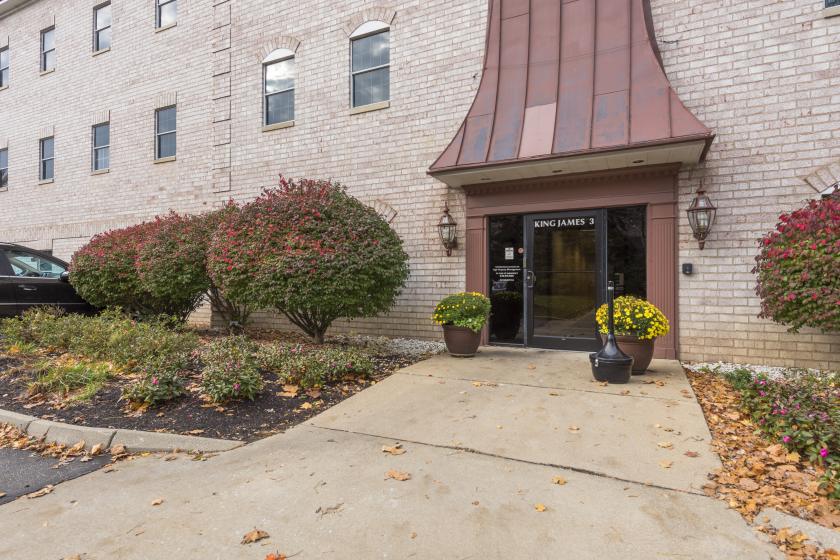
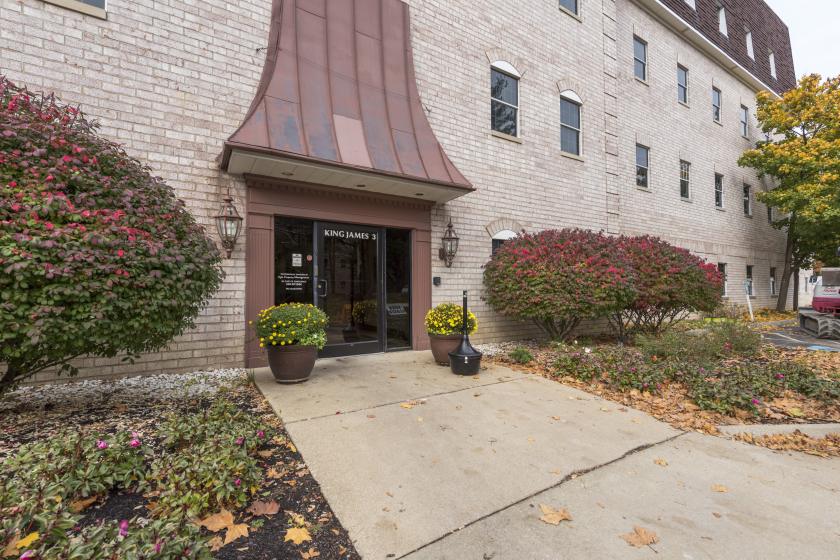
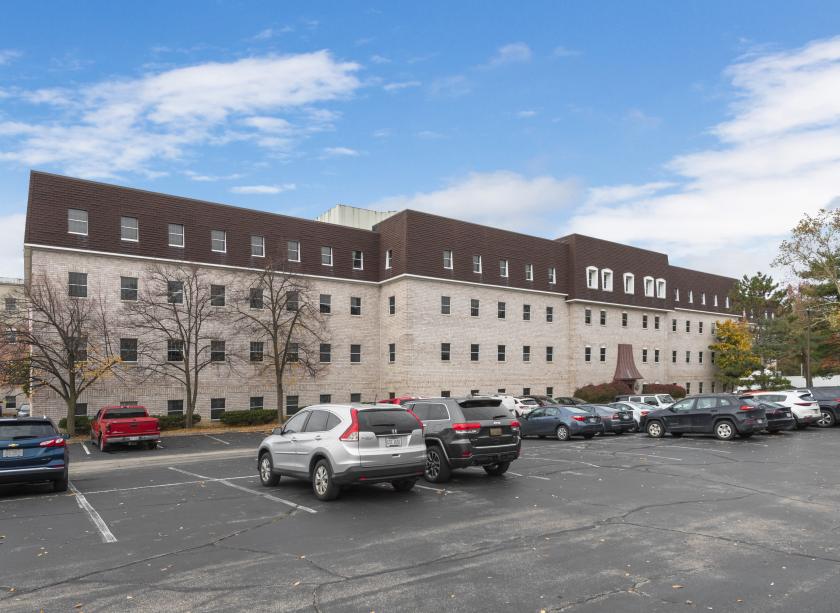
1-Mile | 3-Miles | 5-Miles | ||
---|---|---|---|---|
Total Population | 6,853 | 78,593 | 161,392 | |
Population Median Age | 43 | 42 | 41 | |
Population by Age | 0-9 Yrs | 719 (10%) | 8954 (11%) | 17984 (11%) |
10-19 Yrs | 965 (14%) | 9731 (12%) | 19390 (12%) | |
20-29 Yrs | 710 (10%) | 8522 (10%) | 19171 (11%) | |
30-39 Yrs | 509 (7%) | 9278 (11%) | 20250 (12%) | |
40-49 Yrs | 733 (10%) | 9405 (11%) | 19892 (12%) | |
50-59 Yrs | 1241 (18%) | 10556 (13%) | 22578 (13%) | |
60-69 Yrs | 1078 (15%) | 10843 (13%) | 21639 (13%) | |
70+ Yrs | 897 (13%) | 11305 (14%) | 20487 (12%) | |
Median HH Income | $84,740 | $79,426 | $74,457 | |
Total Household Income | < 24K | 319 (11%) | 3881 (11%) | 10072 (14%) |
25-49K | 390 (13%) | 6010 (17%) | 12671 (18%) | |
50-74K | 523 (18%) | 6052 (18%) | 12531 (17%) | |
75-99K | 491 (17%) | 4626 (13%) | 9408 (13%) | |
100-199K | 715 (25%) | 9010 (26%) | 18256 (26%) | |
200K+ | 408 (14%) | 3947 (11%) | 7129 (10%) | |
Highest Education Level | No Diploma | 87 | 1987 | 5790 |
Diploma or GED | 952 | 11591 | 24273 | |
Some College | 918 | 9652 | 21565 | |
Assoc. Degree | 392 | 4736 | 8817 | |
Bachelors Degree | 1513 | 16891 | 33446 | |
Higher Degree | 879 | 11176 | 22123 | |
Total Housing Units | 2,962 | 35,820 | 75,136 | |
--Owner-Occupied | 2,527 | 24,522 | 49,178 | |
--Renter-Occupied | 319 | 9,004 | 20,887 | |
Owner-Occupied Values | < 100K | 196 | 2122 | 5625 |
100-199K | 966 | 10767 | 21589 | |
200-299K | 699 | 6171 | 11451 | |
300-399K | 356 | 3076 | 5568 | |
400-499K | 82 | 944 | 2007 | |
500K+ | 229 | 1441 | 2938 | |
Total Working Age Population | 5,609 | 63,250 | 130,953 | |
In Work Force | 3,725 | 41,938 | 88,659 | |
Not In Work Force | 1,884 | 21,312 | 42,294 | |
Workforce Employed | 3,547 | 40,559 | 85,385 | |
Workforce Unemployed | 178 | 1,352 | 3,235 | |
Civlian Workforce | 3,725 | 41,911 | 88,621 | |
Military Workforce | 0 | 27 | 39 | |
Total Households | 2,846 | 33,526 | 70,066 | |
Family Households | 1,874 | 20,182 | 40,543 | |
Non-Family Households | 972 | 13,344 | 29,522 | |
Married Couple | 1,526 | 16,355 | 32,159 | |
Other Family | 348 | 3,826 | 8,384 | |
Married w/Child | 557 | 6,622 | 12,725 | |
Single Male w/Child | 34 | 636 | 1,384 | |
Single Female w/Child | 175 | 1,257 | 2,900 |
Population Change Last Two Decades - Plus Projection
2000 | % | 2010 | % | 2020 | % | 2030 | |
---|---|---|---|---|---|---|---|
Ohio | 11,353,140 | +2 | 11,536,504 | 0 | 11,574,870 | 0 | 11,615,100 |
Lorain County | 284,664 | +6 | 301,356 | +3 | 310,230 | +3 | 320,430 |
Cuyahoga County | 1,393,978 | -8 | 1,280,122 | -6 | 1,209,550 | -5 | 1,154,210 |
Total Working Age Population:
Total Households:
Total Working Age Population:
Total Households:
Total Working Age Population:
Total Households: