Industrial Properties
1423 North 29th Street Sheboygan, WI 53081
1423 North 29th Street Sheboygan, WI 53081
Details & Description
Property Highlights
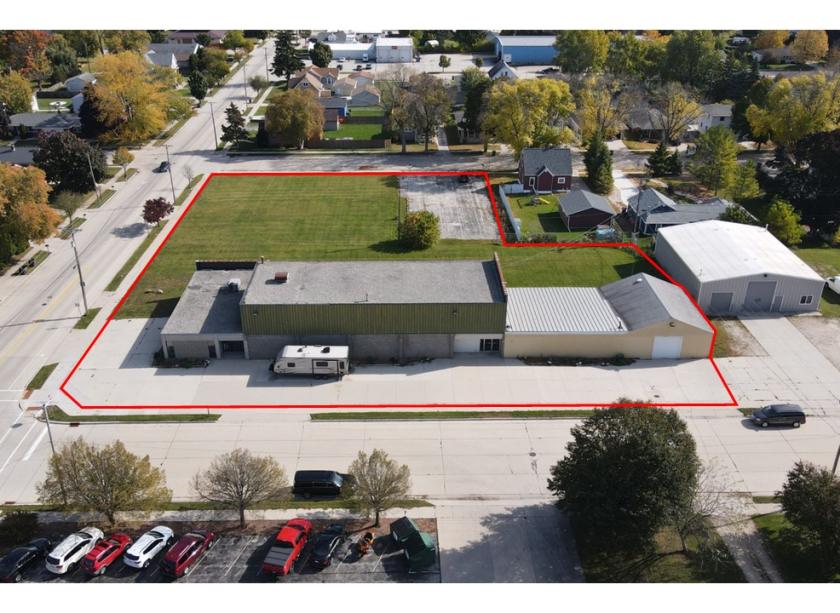
• Great opportunity to own a conveniently located commercial building on Superior Avenue near St. Nicholas Hospital.
• Great opportunity for a wholesale business, fitness center, recreational facility, offices with storage, etc.
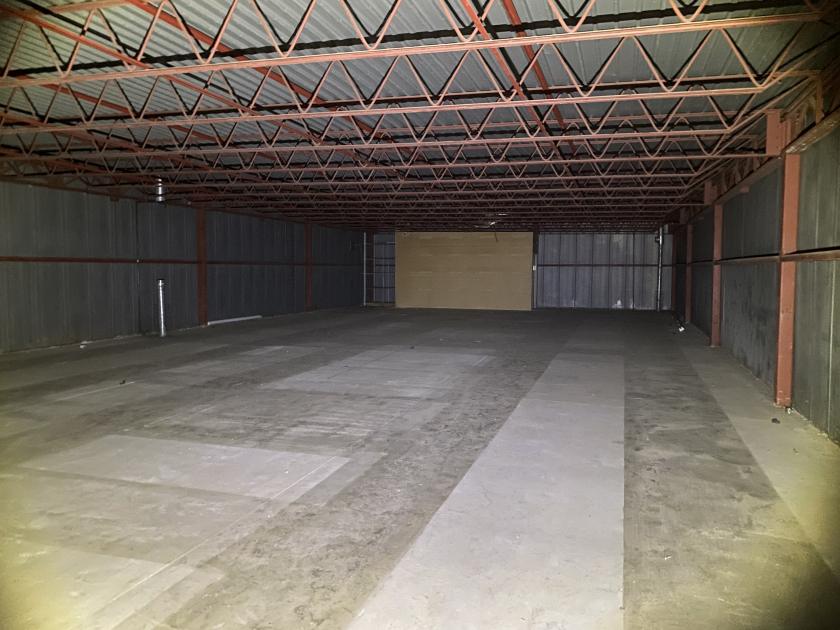
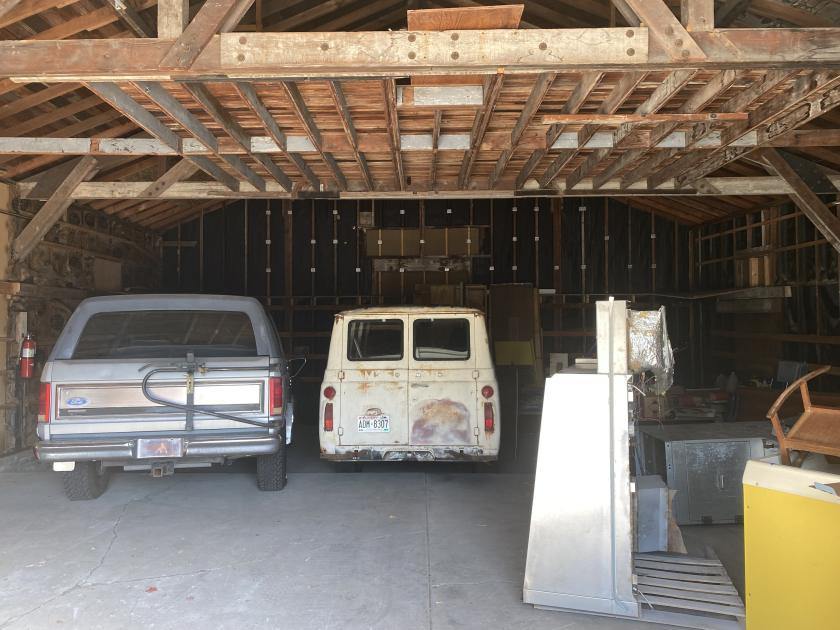
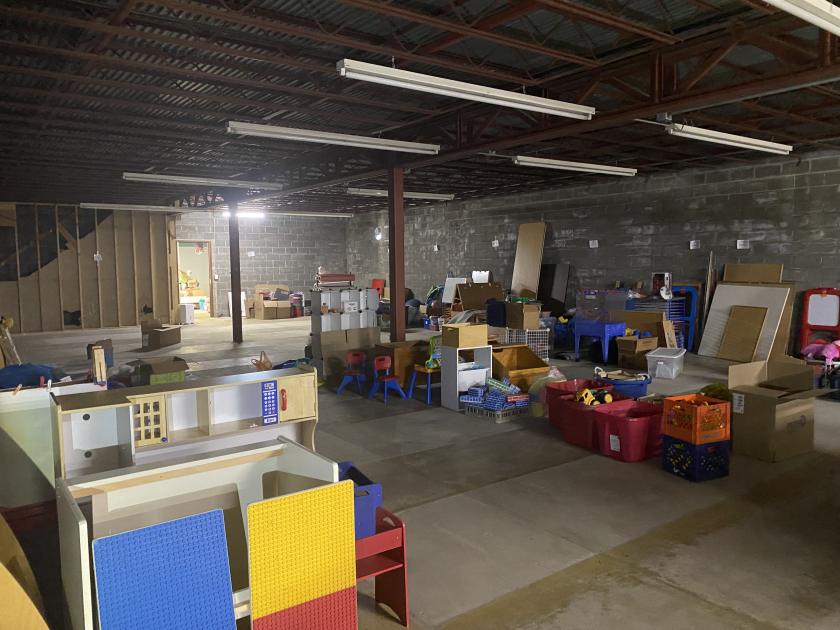
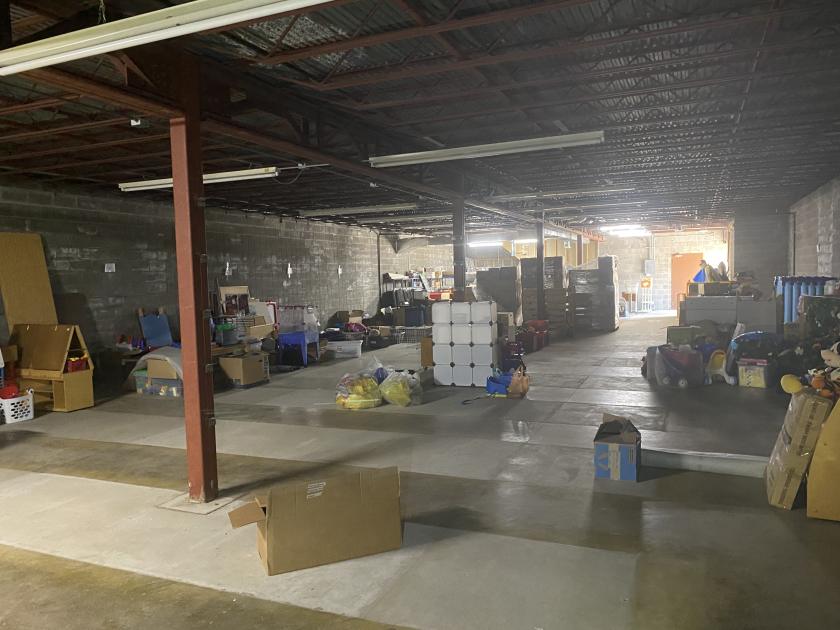
Additional Photos
Listing Agents

Dane Checolinski
O: 920-783-6330
M: 920-344-8732
danec@naipfefferle.com
O: 920-783-6330
M: 920-344-8732
danec@naipfefferle.com
While we strive to provide the most accurate information, all listing information, and demographic data, is provided by third-parties. As such, MyEListing will not be responsible for the accuracy of the information. It is strongly recommended that you verify all information with the listing agent, and any relevant agencies, prior to making any decisions.


