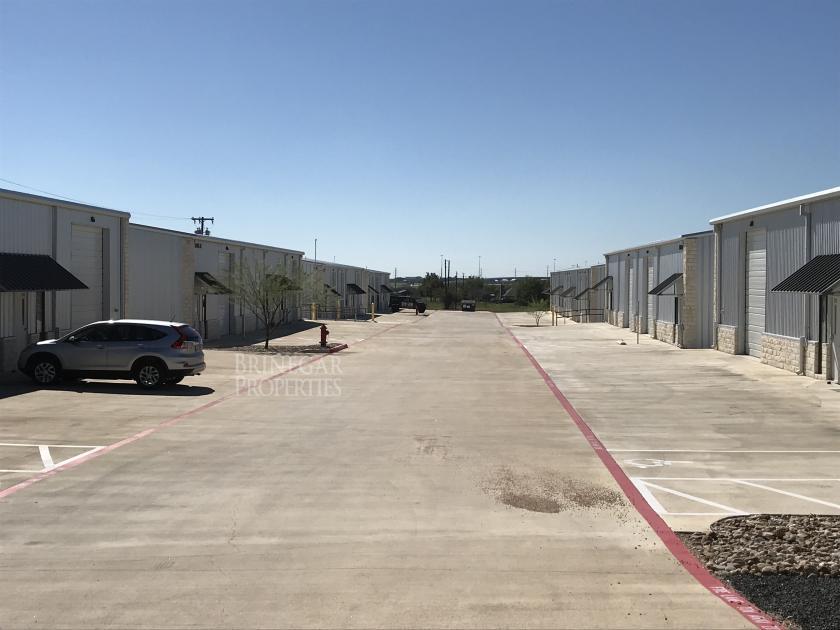
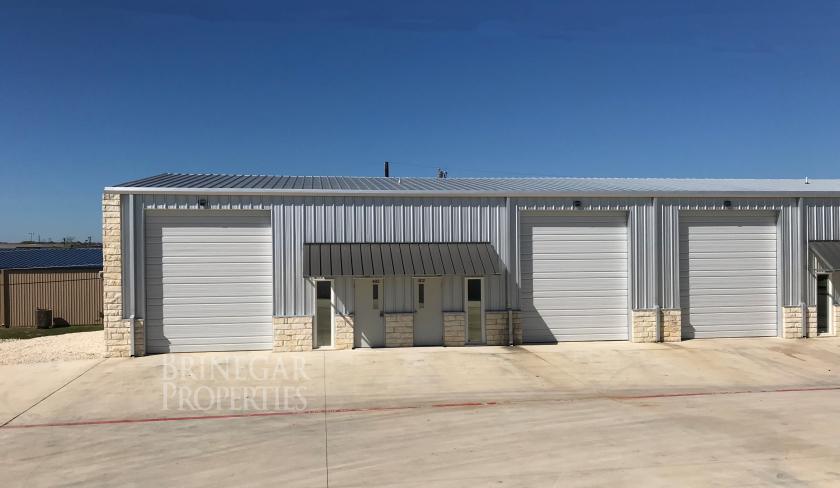
1-Mile | 3-Miles | 5-Miles | ||
---|---|---|---|---|
Total Population | 11,596 | 74,692 | 170,113 | |
Population Median Age | 35 | 34 | 35 | |
Population by Age | 0-9 Yrs | 1106 (9%) | 10271 (13%) | 22805 (13%) |
10-19 Yrs | 2916 (25%) | 14755 (19%) | 27805 (16%) | |
20-29 Yrs | 1022 (8%) | 6625 (8%) | 19931 (11%) | |
30-39 Yrs | 837 (7%) | 11218 (15%) | 27371 (16%) | |
40-49 Yrs | 2566 (22%) | 13927 (18%) | 30673 (18%) | |
50-59 Yrs | 2087 (17%) | 9580 (12%) | 21123 (12%) | |
60-69 Yrs | 544 (4%) | 4943 (6%) | 12382 (7%) | |
70+ Yrs | 519 (4%) | 3373 (4%) | 8023 (4%) | |
Median HH Income | $111,459 | $113,125 | $99,142 | |
Total Household Income | < 24K | 81 (2%) | 930 (4%) | 3140 (5%) |
25-49K | 191 (6%) | 1680 (7%) | 6529 (11%) | |
50-74K | 428 (14%) | 2991 (13%) | 8177 (14%) | |
75-99K | 581 (19%) | 3749 (16%) | 9763 (17%) | |
100-199K | 1479 (49%) | 10368 (45%) | 21973 (40%) | |
200K+ | 241 (8%) | 3139 (13%) | 4967 (9%) | |
Highest Education Level | No Diploma | 417 | 2547 | 6752 |
Diploma or GED | 1779 | 9838 | 24488 | |
Some College | 2264 | 10495 | 26581 | |
Assoc. Degree | 374 | 3967 | 10257 | |
Bachelors Degree | 1865 | 13808 | 30494 | |
Higher Degree | 572 | 6636 | 12778 | |
Total Housing Units | 3,081 | 23,879 | 57,225 | |
--Owner-Occupied | 2,490 | 18,580 | 40,762 | |
--Renter-Occupied | 512 | 4,278 | 13,786 | |
Owner-Occupied Values | < 100K | 65 | 259 | 769 |
100-199K | 154 | 1446 | 7303 | |
200-299K | 1014 | 7854 | 19181 | |
300-399K | 1038 | 6165 | 9889 | |
400-499K | 44 | 1681 | 2125 | |
500K+ | 174 | 1176 | 1495 | |
Total Working Age Population | 8,061 | 53,880 | 129,154 | |
In Work Force | 6,115 | 41,147 | 98,434 | |
Not In Work Force | 1,945 | 12,733 | 30,720 | |
Workforce Employed | 5,885 | 39,074 | 93,433 | |
Workforce Unemployed | 225 | 1,840 | 4,685 | |
Civlian Workforce | 6,110 | 40,914 | 98,119 | |
Military Workforce | 5 | 233 | 315 | |
Total Households | 3,001 | 22,858 | 54,548 | |
Family Households | 2,707 | 18,869 | 42,112 | |
Non-Family Households | 295 | 3,988 | 12,437 | |
Married Couple | 2,443 | 15,952 | 34,267 | |
Other Family | 264 | 2,917 | 7,845 | |
Married w/Child | 1,359 | 9,395 | 18,732 | |
Single Male w/Child | 5 | 549 | 1,183 | |
Single Female w/Child | 83 | 1,275 | 3,337 |
Population Change Last Two Decades - Plus Projection
2000 | % | 2010 | % | 2020 | % | 2030 | |
---|---|---|---|---|---|---|---|
Texas | 20,851,820 | +21 | 25,145,561 | +18 | 29,677,668 | +18 | 34,894,452 |
Travis County | 812,280 | +26 | 1,024,266 | +26 | 1,291,502 | +19 | 1,540,812 |
Williamson County | 249,967 | +69 | 422,679 | +40 | 589,914 | +41 | 830,421 |
Total Working Age Population:
Total Households:
Total Working Age Population:
Total Households:
Total Working Age Population:
Total Households: