Office Space
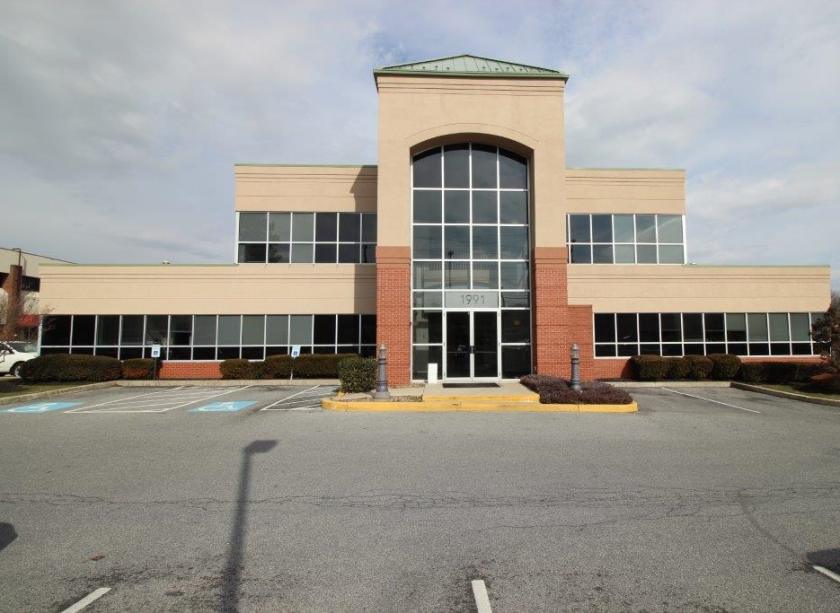
1991 State Hill Road Wyomissing, PA 19610
1991 State Hill Road Wyomissing, PA 19610
Details & Description
Property Highlights
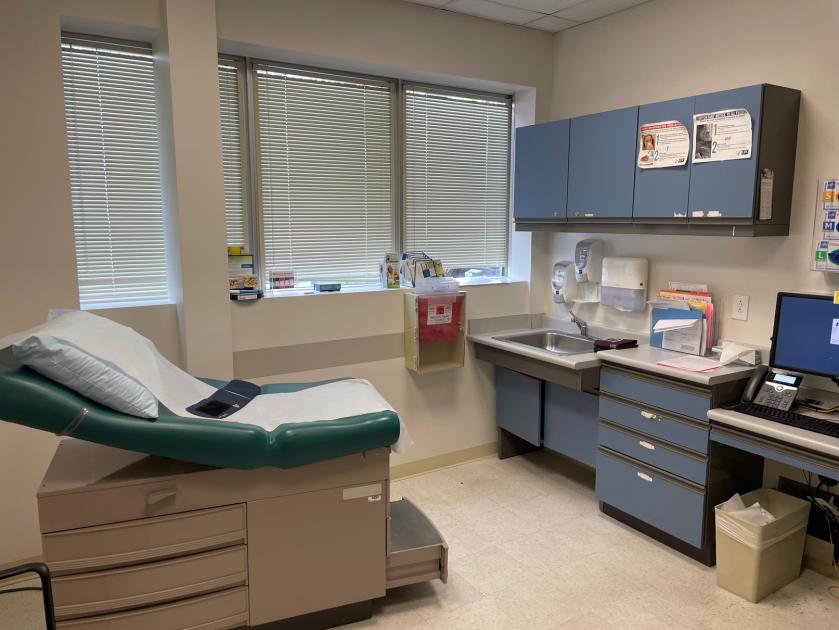
• Turnkey +/- 8,205 SF - modern medical office on entire first floor
• 11 offices, 15 exam rooms, 2 staff and 2 public bathrooms
Listing Agents

Robert Cook
O: 484-370-2655
M: 267-847-7609
bcook@jacksoncross.com
O: 484-370-2655
M: 267-847-7609
bcook@jacksoncross.com

Mike Barnes
O: 484-370-2655
M: 267-847-7609
mbarnes@jacksoncross.com
O: 484-370-2655
M: 267-847-7609
mbarnes@jacksoncross.com
While we strive to provide the most accurate information, all listing information, and demographic data, is provided by third-parties. As such, MyEListing will not be responsible for the accuracy of the information. It is strongly recommended that you verify all information with the listing agent, and any relevant agencies, prior to making any decisions.