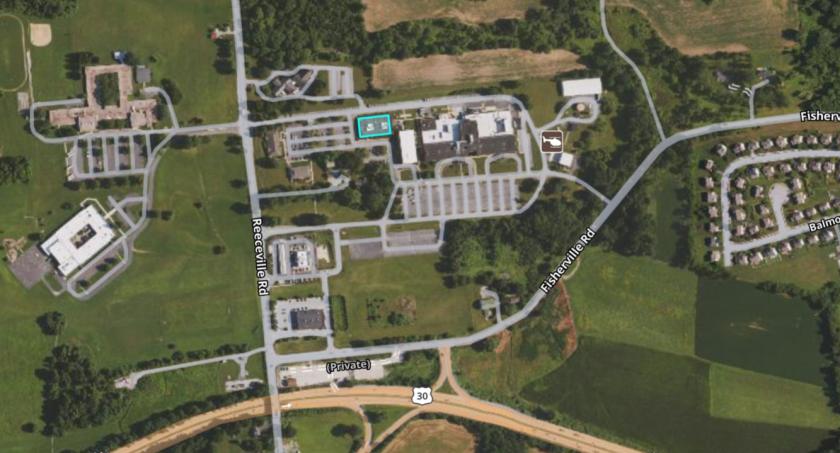
1-Mile | 3-Miles | 5-Miles | ||
---|---|---|---|---|
Total Population | 4,683 | 39,526 | 80,315 | |
Population Median Age | 45 | 39 | 39 | |
Population by Age | 0-9 Yrs | 430 (9%) | 5364 (13%) | 10332 (12%) |
10-19 Yrs | 604 (12%) | 5295 (13%) | 10499 (13%) | |
20-29 Yrs | 426 (9%) | 4115 (10%) | 8797 (10%) | |
30-39 Yrs | 436 (9%) | 5175 (13%) | 10168 (12%) | |
40-49 Yrs | 579 (12%) | 5186 (13%) | 11191 (13%) | |
50-59 Yrs | 674 (14%) | 5693 (14%) | 12066 (15%) | |
60-69 Yrs | 549 (11%) | 4608 (11%) | 9076 (11%) | |
70+ Yrs | 986 (21%) | 4089 (10%) | 8186 (10%) | |
Median HH Income | $78,250 | $79,984 | $85,587 | |
Total Household Income | < 24K | 246 (14%) | 1854 (12%) | 3369 (11%) |
25-49K | 226 (13%) | 2451 (17%) | 4758 (16%) | |
50-74K | 327 (19%) | 2486 (17%) | 5089 (17%) | |
75-99K | 213 (12%) | 1966 (13%) | 3806 (12%) | |
100-199K | 463 (27%) | 4293 (29%) | 9207 (31%) | |
200K+ | 179 (10%) | 1316 (9%) | 3427 (11%) | |
Highest Education Level | No Diploma | 128 | 2011 | 3517 |
Diploma or GED | 845 | 7591 | 15409 | |
Some College | 524 | 4331 | 8913 | |
Assoc. Degree | 292 | 2470 | 4747 | |
Bachelors Degree | 1100 | 6816 | 15054 | |
Higher Degree | 591 | 3839 | 8041 | |
Total Housing Units | 1,740 | 15,255 | 31,158 | |
--Owner-Occupied | 1,257 | 10,153 | 21,720 | |
--Renter-Occupied | 397 | 4,214 | 7,937 | |
Owner-Occupied Values | < 100K | 15 | 928 | 1714 |
100-199K | 124 | 1977 | 3793 | |
200-299K | 457 | 3430 | 6885 | |
300-399K | 470 | 1917 | 4410 | |
400-499K | 77 | 820 | 2043 | |
500K+ | 114 | 1081 | 2875 | |
Total Working Age Population | 3,914 | 30,825 | 63,392 | |
In Work Force | 2,071 | 20,241 | 43,593 | |
Not In Work Force | 1,842 | 10,584 | 19,800 | |
Workforce Employed | 1,922 | 19,163 | 41,441 | |
Workforce Unemployed | 150 | 1,078 | 2,152 | |
Civlian Workforce | 2,071 | 20,241 | 43,593 | |
Military Workforce | 0 | 0 | 0 | |
Total Households | 1,654 | 14,368 | 29,657 | |
Family Households | 1,071 | 10,003 | 21,110 | |
Non-Family Households | 583 | 4,365 | 8,547 | |
Married Couple | 966 | 7,623 | 16,149 | |
Other Family | 105 | 2,380 | 4,961 | |
Married w/Child | 440 | 3,352 | 6,922 | |
Single Male w/Child | 21 | 216 | 453 | |
Single Female w/Child | 24 | 1,056 | 1,861 |
Population Change Last Two Decades - Plus Projection
2000 | % | 2010 | % | 2020 | % | 2030 | |
---|---|---|---|---|---|---|---|
Pennsylvania | 12,281,054 | +3 | 12,702,379 | +4 | 13,230,170 | +4 | 13,759,594 |
Chester County | 433,501 | +15 | 498,886 | +7 | 533,837 | +7 | 573,576 |
Total Working Age Population:
Total Households:
Total Working Age Population:
Total Households:
Total Working Age Population:
Total Households: