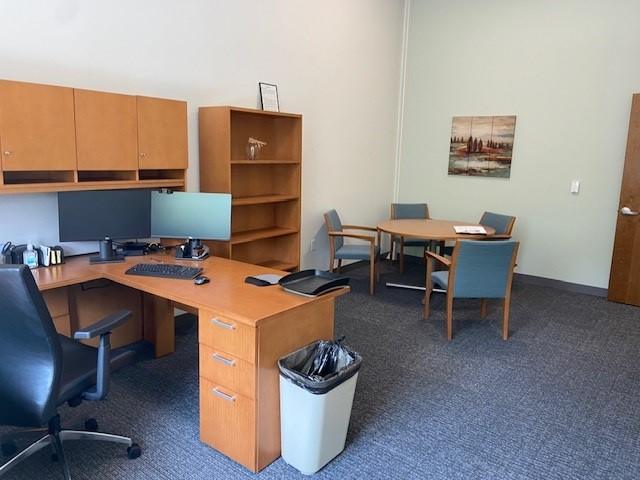
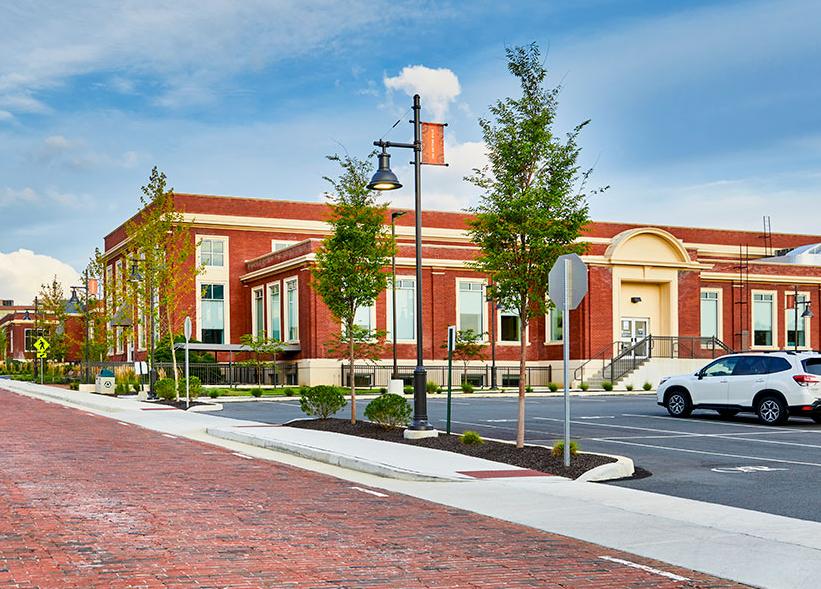
Office Space
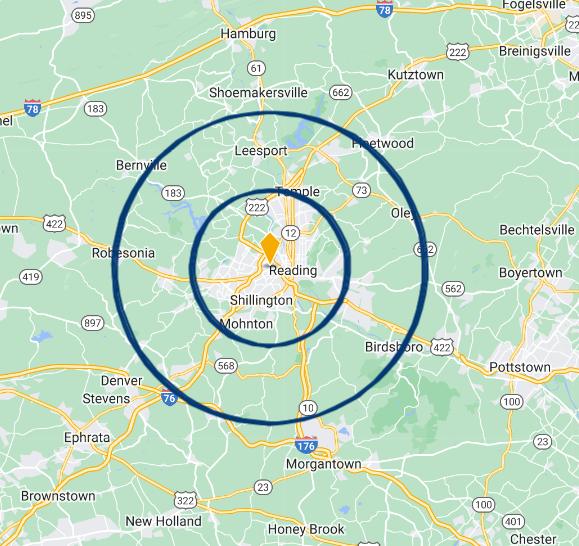
830 Knitting Mills Way Wyomissing, PA 19610
830 Knitting Mills Way Wyomissing, PA 19610
Details & Description
Property Highlights
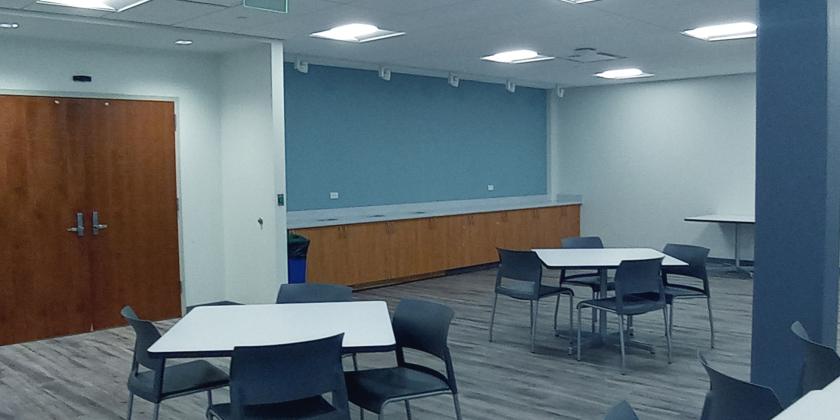
- • Built in 1926 and fully renovated in 2019
- • Zoning: C-2 Retail Commercial District
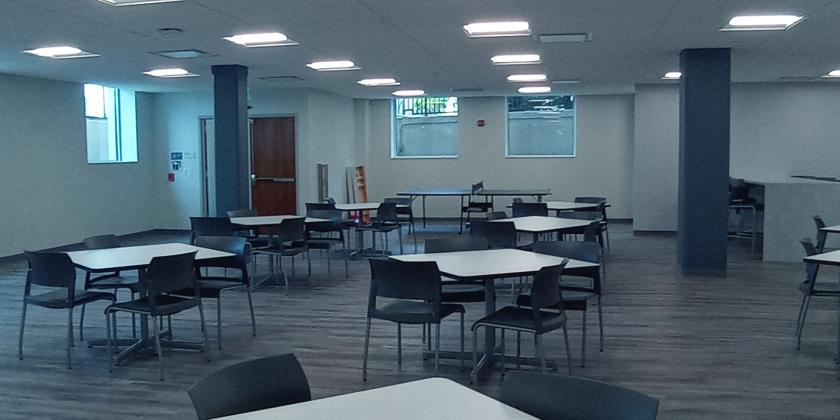
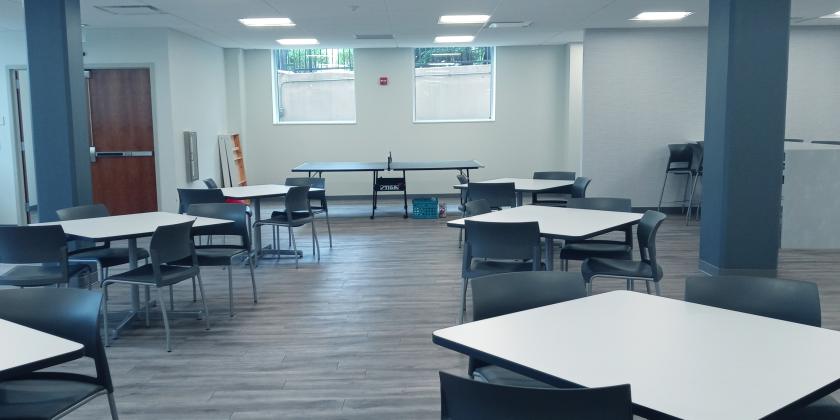
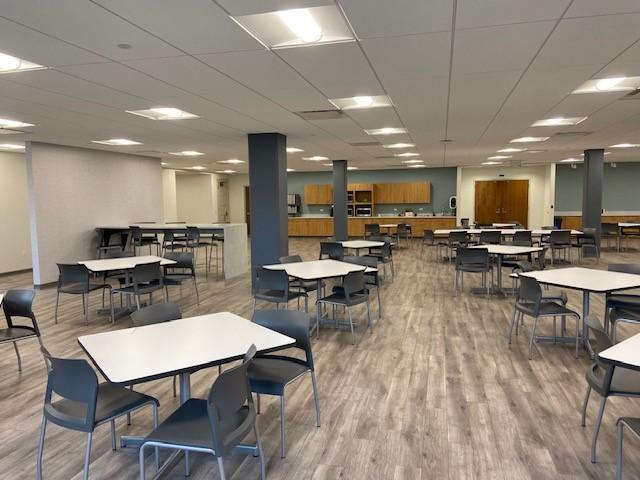
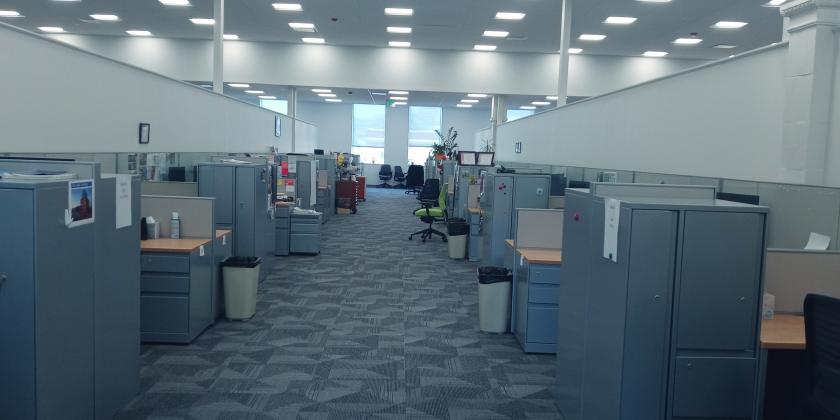
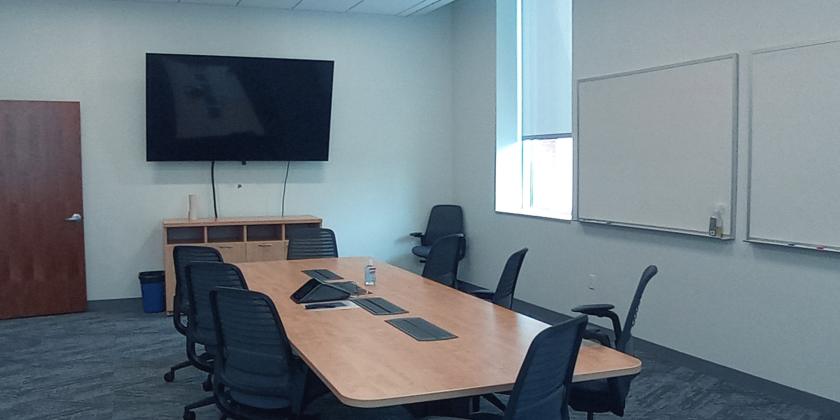
- • New finishes and LED lighting
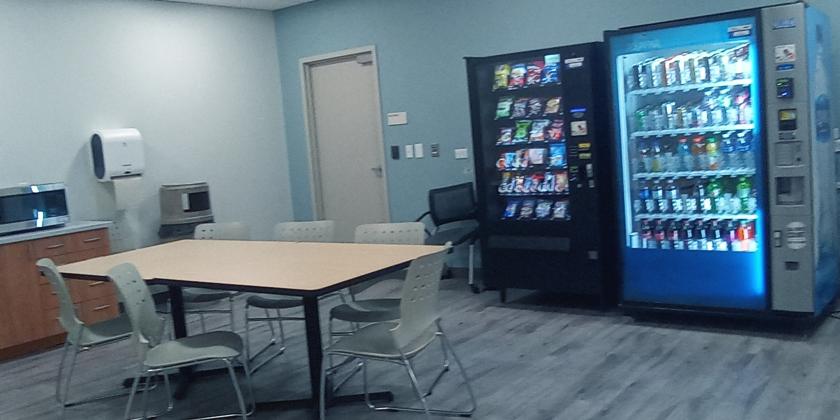
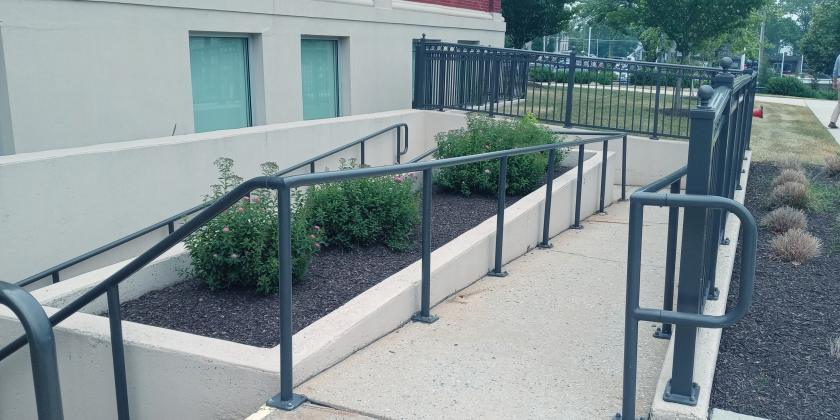
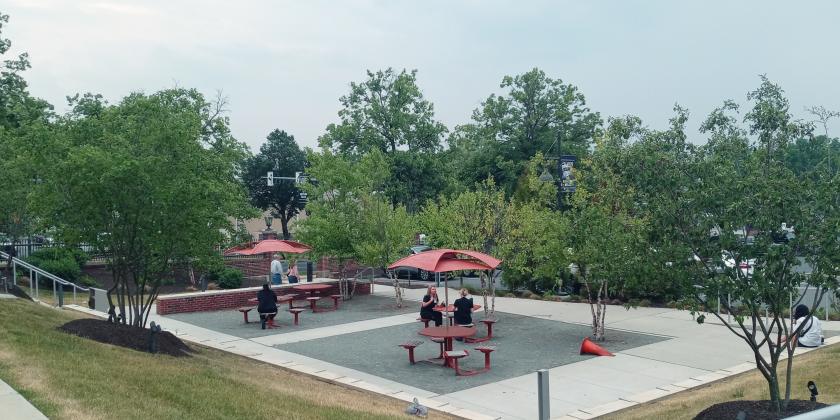
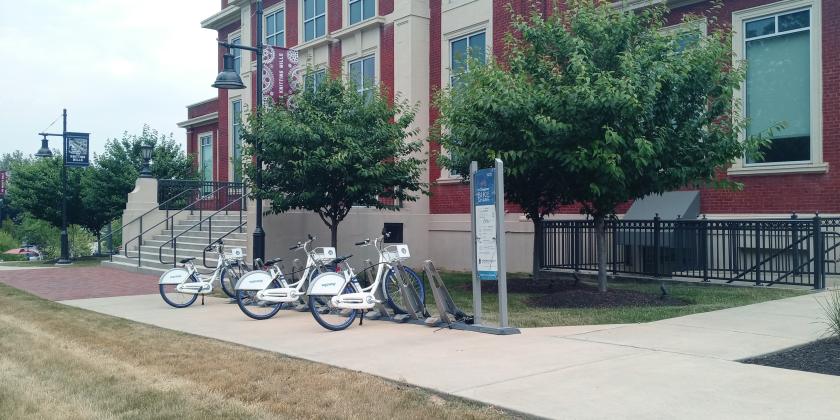
- • Walking distance to nearby amenities
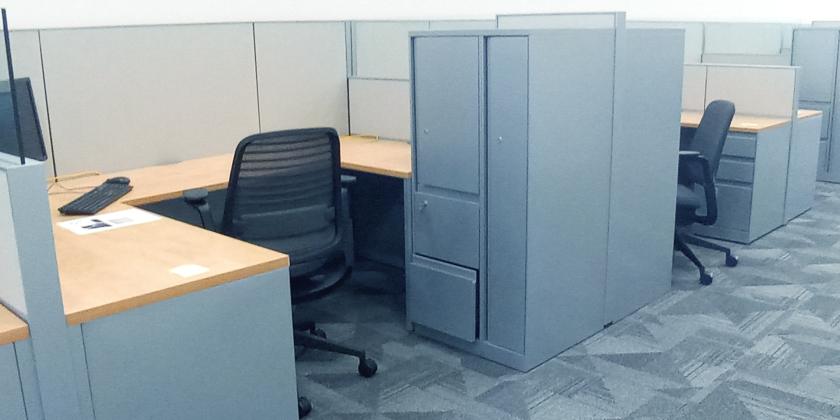
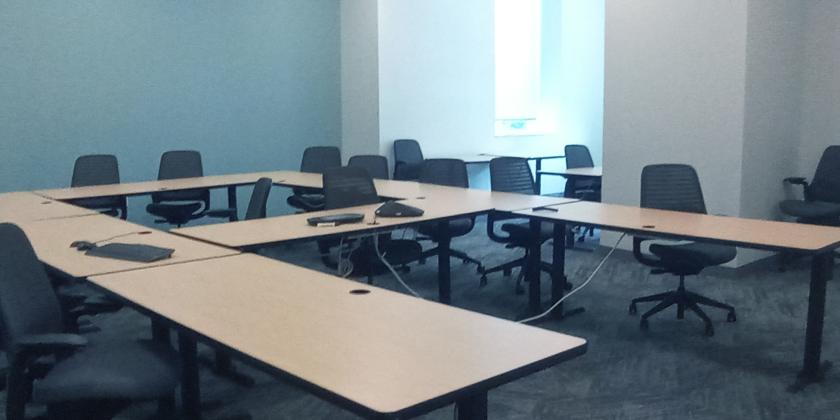
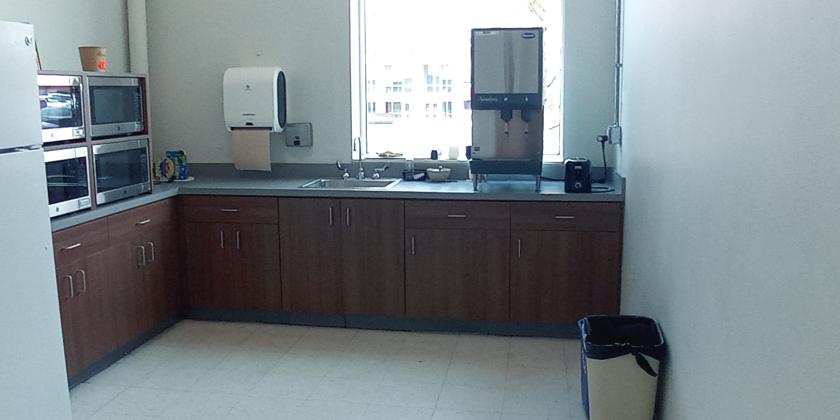
- • Furnishings available
Additional Photos

Listing Agents

Robert Cook
O: 484-370-2655
M: 267-847-7609
bcook@jacksoncross.com
O: 484-370-2655
M: 267-847-7609
bcook@jacksoncross.com

Mike Barnes
O: 484-370-2655
M: 267-847-7609
mbarnes@jacksoncross.com
O: 484-370-2655
M: 267-847-7609
mbarnes@jacksoncross.com
While we strive to provide the most accurate information, all listing information, and demographic data, is provided by third-parties. As such, MyEListing will not be responsible for the accuracy of the information. It is strongly recommended that you verify all information with the listing agent, and any relevant agencies, prior to making any decisions.