Industrial Properties
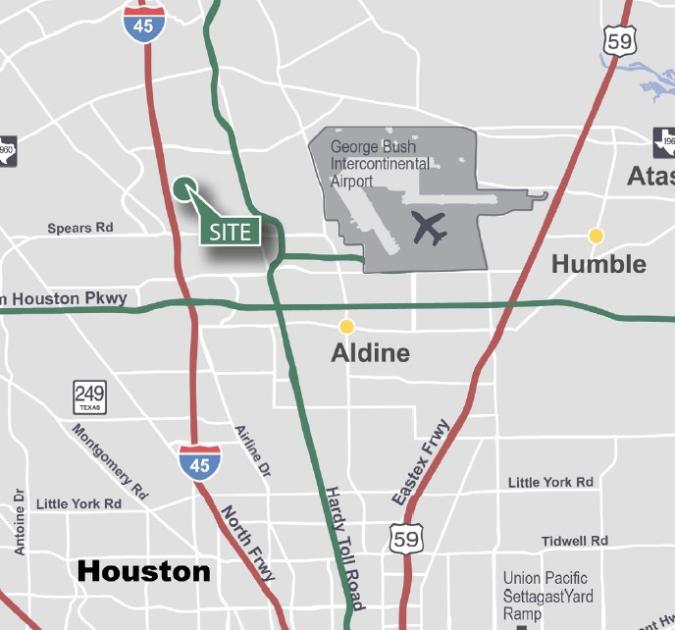
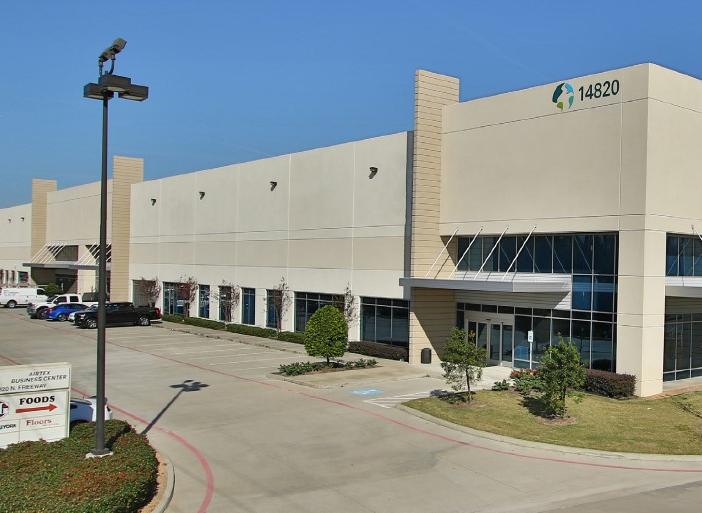
14820 North Freeway Houston, TX 77090
14820 North Freeway Houston, TX 77090
Details & Description
Property Highlights
- • Suite 300: 22,630 SF available
- • 6,664 SF of office
- • 30’ clear height
- • 7 dock-high doors / 1 drive-in ramp
- • 52’ x 50’ column spacing
- • Freeway visibility and signage opportunity
Listing Agents

Walker Barnett
O: 713-830-2127
M: 832-423-7063
walker.barnett@colliers.com
O: 713-830-2127
M: 832-423-7063
walker.barnett@colliers.com

Ryan Byrd
O: 713-830-2171
M: 832-368-4884
ryan.byrd@colliers.com
O: 713-830-2171
M: 832-368-4884
ryan.byrd@colliers.com
While we strive to provide the most accurate information, all listing information, and demographic data, is provided by third-parties. As such, MyEListing will not be responsible for the accuracy of the information. It is strongly recommended that you verify all information with the listing agent, and any relevant agencies, prior to making any decisions.