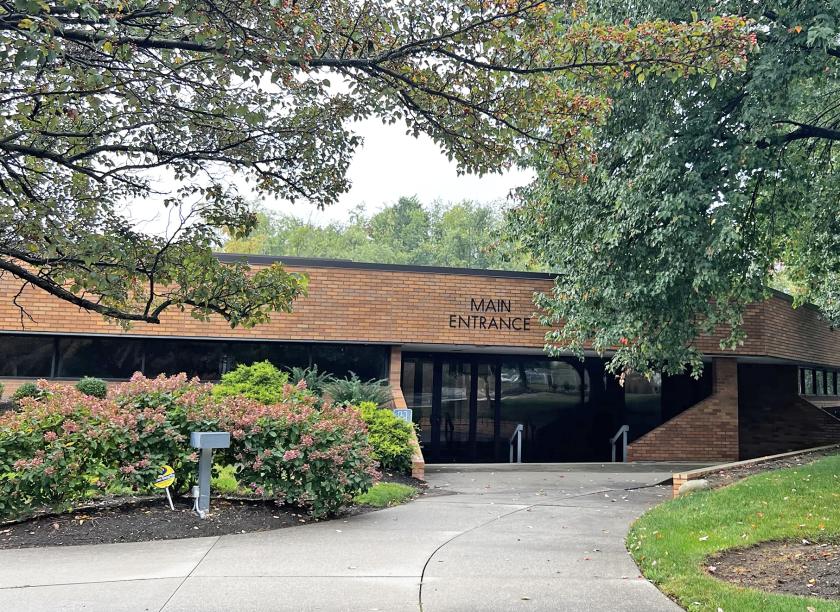
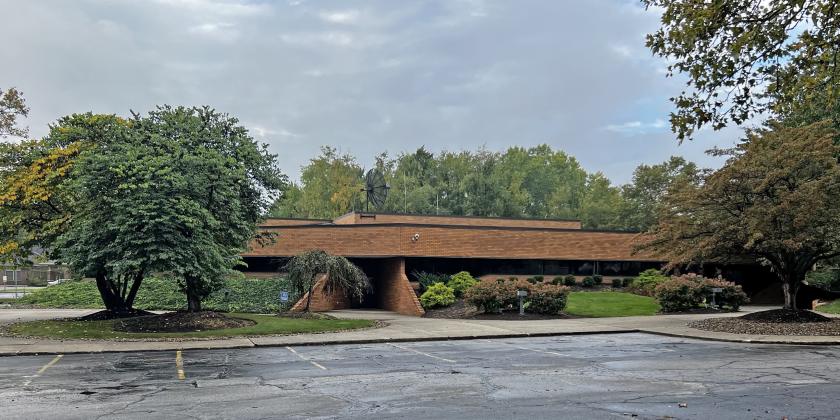
Office Space
1100 Graham Road Circle Stow, OH 44224
1100 Graham Road Circle Stow, OH 44224
Details & Description
Property Highlights
- • Built in 1976, renovated in 2019
- • Built in Health Clinic
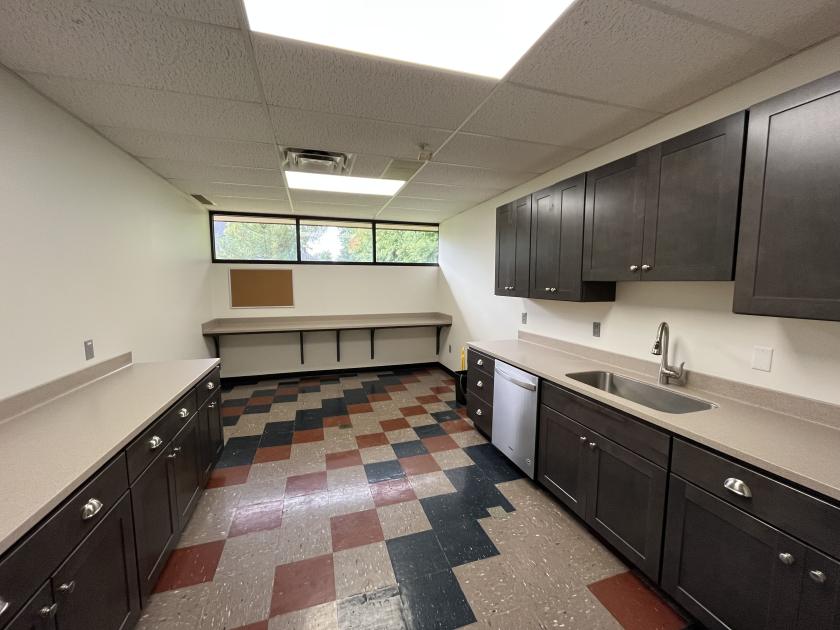
- • Conference Room with Attached Kitchen
- • Abundant Natural Light
- • Ample Power
- • ADA Accessible
Additional Photos

Listing Agents

Jim Pickard
O: 330-472-3526
jim.pickard@naipvc.com
O: 330-472-3526
jim.pickard@naipvc.com

Marissa Rufe
M: 330-204-3873
marissa.rufe@naipvc.com
M: 330-204-3873
marissa.rufe@naipvc.com
While we strive to provide the most accurate information, all listing information, and demographic data, is provided by third-parties. As such, MyEListing will not be responsible for the accuracy of the information. It is strongly recommended that you verify all information with the listing agent, and any relevant agencies, prior to making any decisions.


