Retail Space
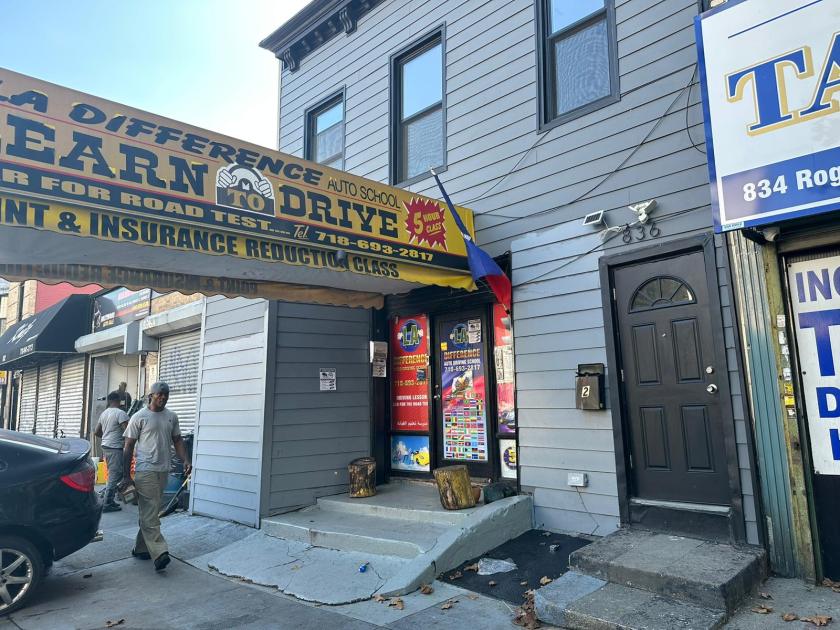
836 Rogers Avenue Brooklyn, NY 11226
836 Rogers Avenue Brooklyn, NY 11226
Details & Description
Property Highlights
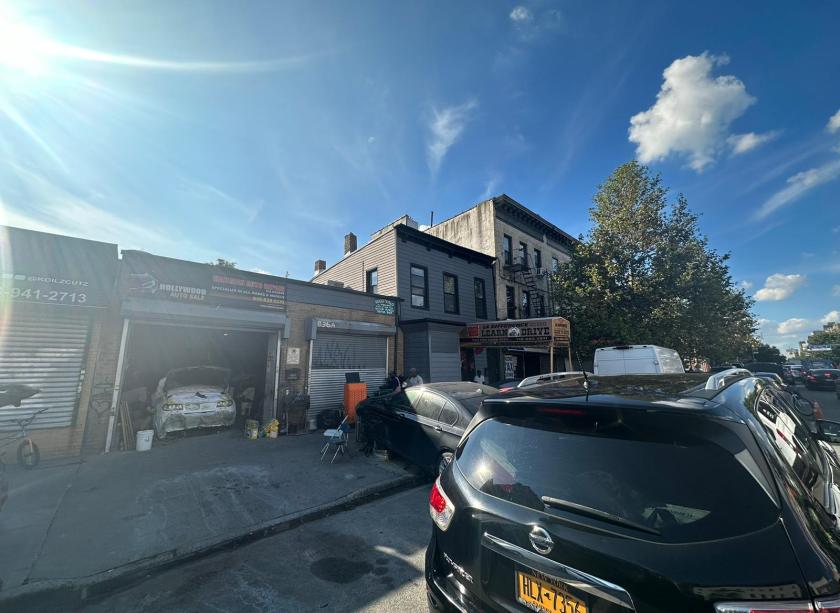
• The subject property is a two-story mixed-use property located in the Flatbush neighborhood of Brooklyn.
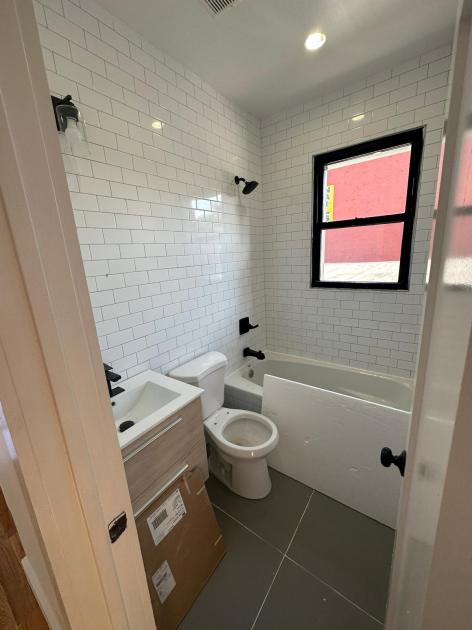
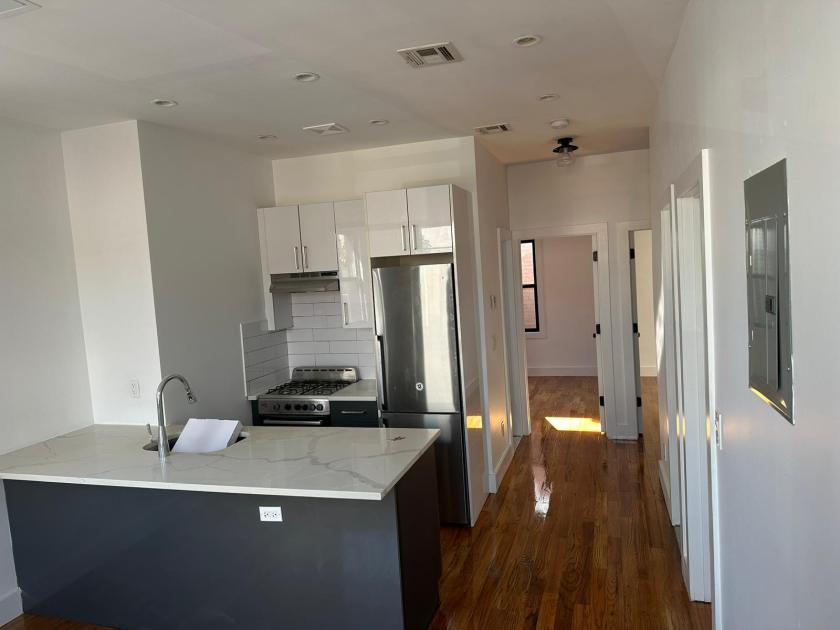
• The second floor of the property features a fully renovated 3-bedroom apartment
Additional Photos


Listing Agents

Sadya Liberow
O: 646-363-6175
M: 347-762-4055
sadya@assetcrg.com
O: 646-363-6175
M: 347-762-4055
sadya@assetcrg.com
While we strive to provide the most accurate information, all listing information, and demographic data, is provided by third-parties. As such, MyEListing will not be responsible for the accuracy of the information. It is strongly recommended that you verify all information with the listing agent, and any relevant agencies, prior to making any decisions.