Specialty Real Estate
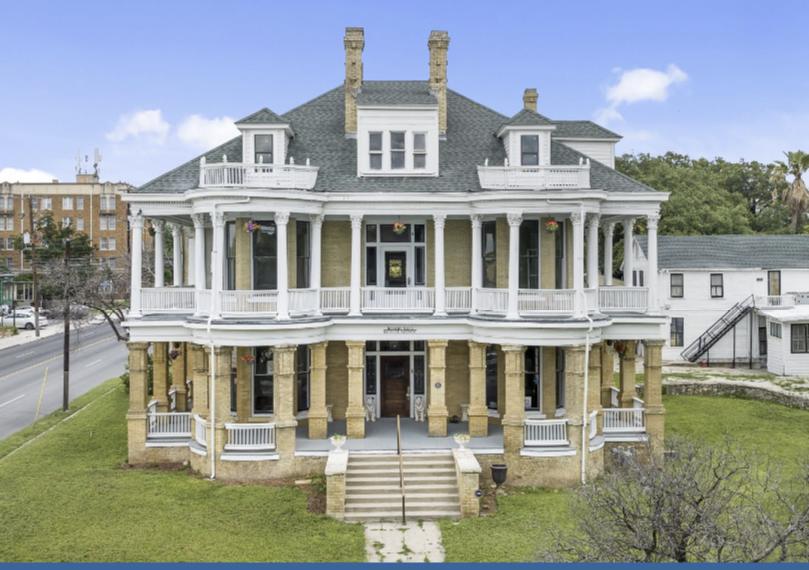
339 West Woodlawn Avenue San Antonio, TX 78212
339 West Woodlawn Avenue San Antonio, TX 78212
Details & Description
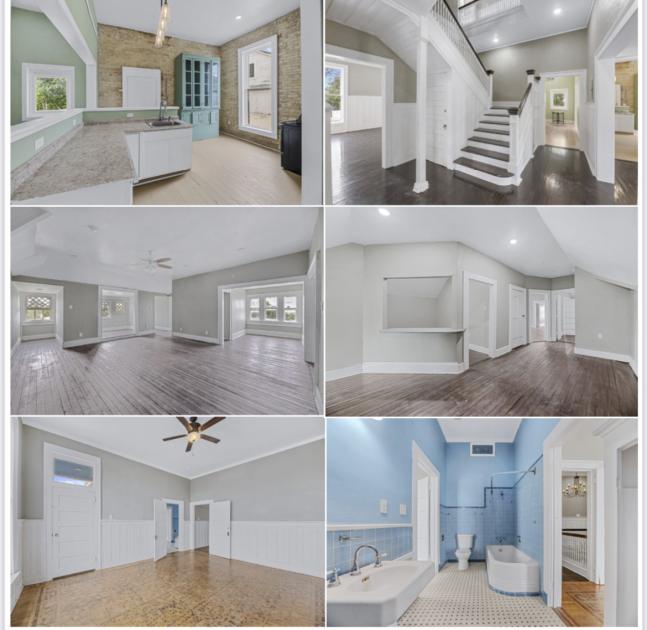
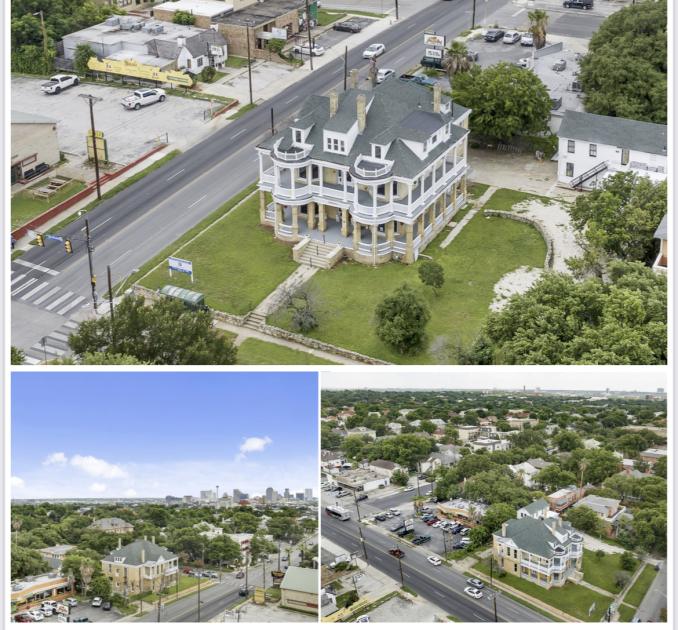
Property Highlights
- • Beautiful City Views
- • Primed for Bed and Breakfast
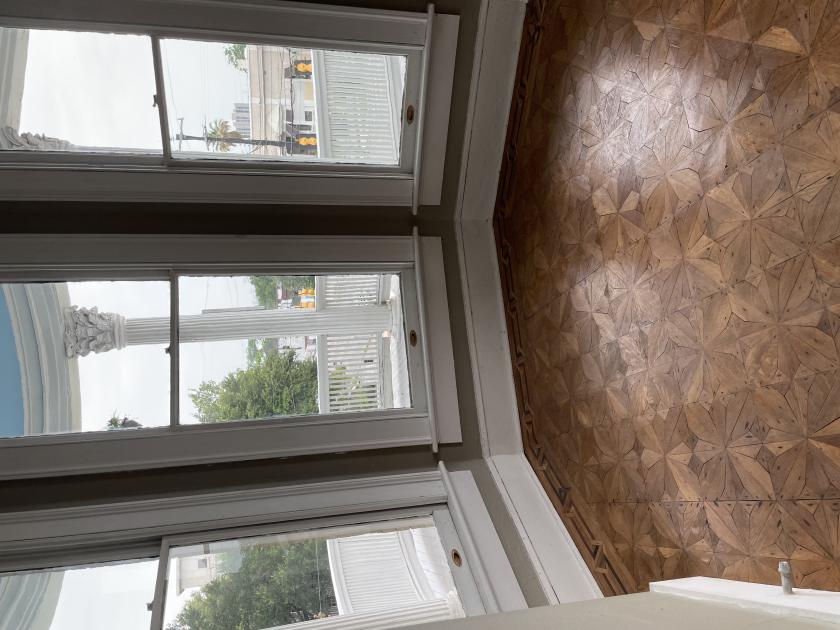
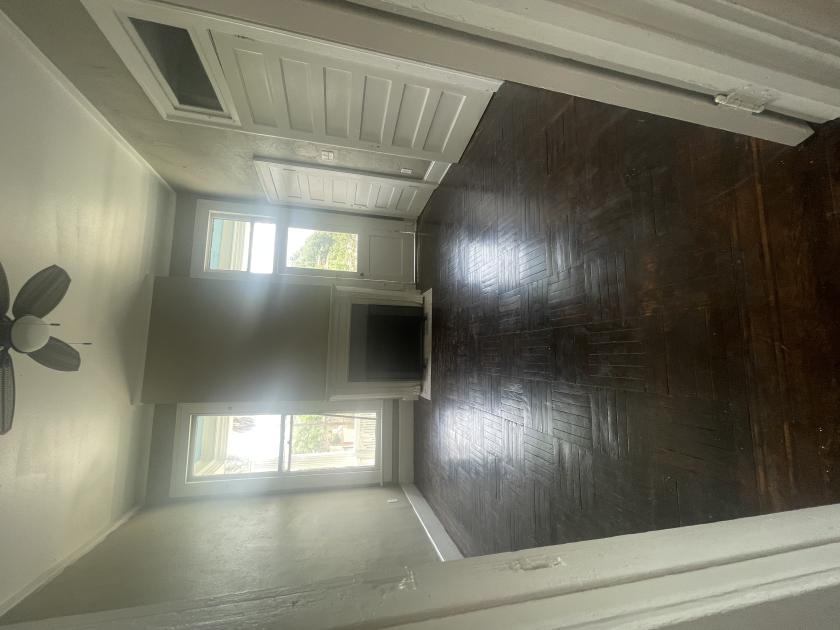
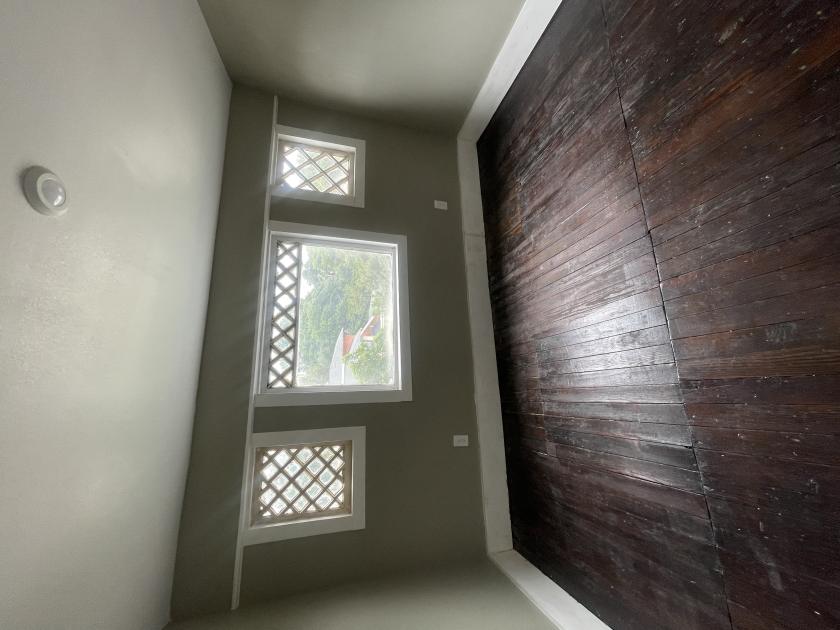
- • Tons of Natural Light Throughout
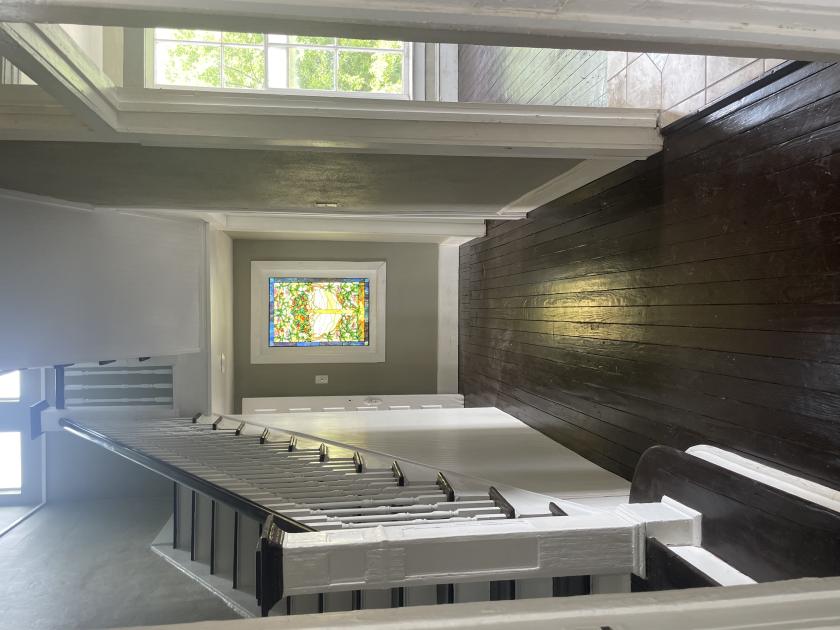
- • Historical Property Preserved
- • Wrap Around Porches
- • Open Concept First Floor
Additional Photos

Listing Agents

Stephanie Flores
floressteph75@gmail.com
floressteph75@gmail.com
While we strive to provide the most accurate information, all listing information, and demographic data, is provided by third-parties. As such, MyEListing will not be responsible for the accuracy of the information. It is strongly recommended that you verify all information with the listing agent, and any relevant agencies, prior to making any decisions.