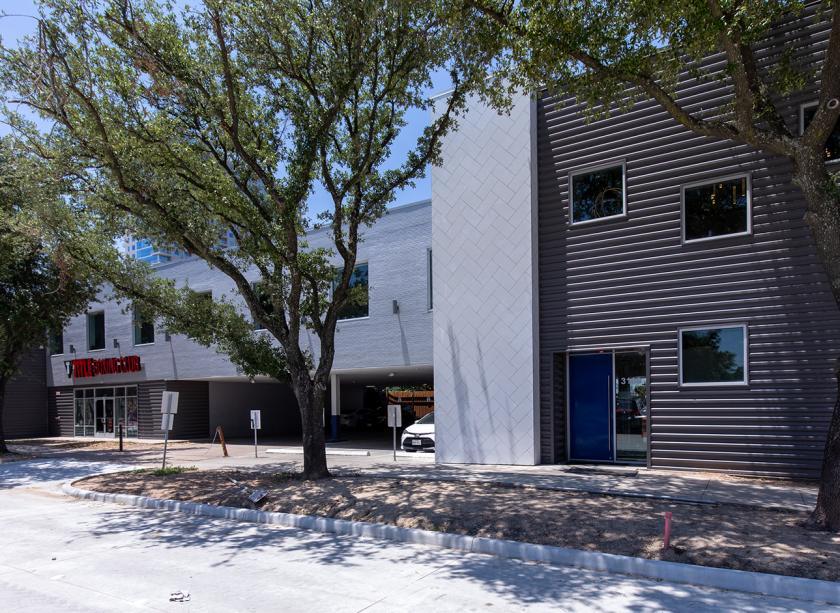
1-Mile | 3-Miles | 5-Miles | ||
---|---|---|---|---|
Total Population | 25,113 | 179,535 | 434,183 | |
Population Median Age | 36 | 37 | 37 | |
Population by Age | 0-9 Yrs | 1723 (6%) | 13050 (7%) | 44905 (10%) |
10-19 Yrs | 711 (2%) | 14556 (8%) | 38580 (8%) | |
20-29 Yrs | 8567 (34%) | 47271 (26%) | 93611 (21%) | |
30-39 Yrs | 6074 (24%) | 38344 (21%) | 83229 (19%) | |
40-49 Yrs | 2833 (11%) | 20355 (11%) | 53086 (12%) | |
50-59 Yrs | 2340 (9%) | 18896 (10%) | 47953 (11%) | |
60-69 Yrs | 1688 (6%) | 15727 (8%) | 40781 (9%) | |
70+ Yrs | 1177 (4%) | 11337 (6%) | 32037 (7%) | |
Median HH Income | $76,459 | $83,678 | $73,837 | |
Total Household Income | < 24K | 2595 (17%) | 14057 (16%) | 37291 (19%) |
25-49K | 2022 (13%) | 11212 (13%) | 31428 (16%) | |
50-74K | 2625 (17%) | 12936 (15%) | 28887 (14%) | |
75-99K | 1882 (12%) | 9672 (11%) | 20148 (10%) | |
100-199K | 3594 (24%) | 20087 (24%) | 40953 (21%) | |
200K+ | 1986 (13%) | 15162 (18%) | 34069 (17%) | |
Highest Education Level | No Diploma | 612 | 9454 | 38330 |
Diploma or GED | 1571 | 15268 | 44596 | |
Some College | 2585 | 17377 | 40512 | |
Assoc. Degree | 952 | 5849 | 13535 | |
Bachelors Degree | 7570 | 43276 | 90809 | |
Higher Degree | 6181 | 39830 | 84707 | |
Total Housing Units | 17,148 | 96,238 | 220,882 | |
--Owner-Occupied | 4,276 | 31,589 | 83,036 | |
--Renter-Occupied | 10,428 | 51,538 | 109,739 | |
Owner-Occupied Values | < 100K | 166 | 1235 | 10904 |
100-199K | 405 | 3693 | 12083 | |
200-299K | 694 | 4868 | 9381 | |
300-399K | 1142 | 6340 | 11932 | |
400-499K | 711 | 3881 | 8850 | |
500K+ | 1159 | 11572 | 29887 | |
Total Working Age Population | 23,011 | 160,390 | 367,840 | |
In Work Force | 18,671 | 107,929 | 246,689 | |
Not In Work Force | 4,339 | 52,461 | 121,151 | |
Workforce Employed | 17,738 | 102,397 | 233,591 | |
Workforce Unemployed | 933 | 5,396 | 12,890 | |
Civlian Workforce | 18,671 | 107,793 | 246,481 | |
Military Workforce | 0 | 136 | 208 | |
Total Households | 14,704 | 83,127 | 192,776 | |
Family Households | 3,886 | 31,700 | 89,889 | |
Non-Family Households | 10,818 | 51,427 | 102,887 | |
Married Couple | 2,926 | 24,028 | 65,009 | |
Other Family | 960 | 7,672 | 24,880 | |
Married w/Child | 602 | 6,857 | 23,147 | |
Single Male w/Child | 89 | 845 | 2,774 | |
Single Female w/Child | 370 | 2,221 | 8,034 |
Population Change Last Two Decades - Plus Projection
2000 | % | 2010 | % | 2020 | % | 2030 | |
---|---|---|---|---|---|---|---|
Texas | 20,851,820 | +21 | 25,145,561 | +18 | 29,677,668 | +18 | 34,894,452 |
Harris County | 3,400,578 | +20 | 4,092,459 | +22 | 4,978,845 | +19 | 5,924,750 |
Total Working Age Population:
Total Households:
Total Working Age Population:
Total Households:
Total Working Age Population:
Total Households: