Office Space
6601 Centerville Business Parkway Dayton, OH 45459
6601 Centerville Business Parkway Dayton, OH 45459

Details & Description
Property Highlights
• Full-service lease, negotiable tenant allowance, workstation furnishings available.
• Available suite is a first-floor corner location with open, flexible space.
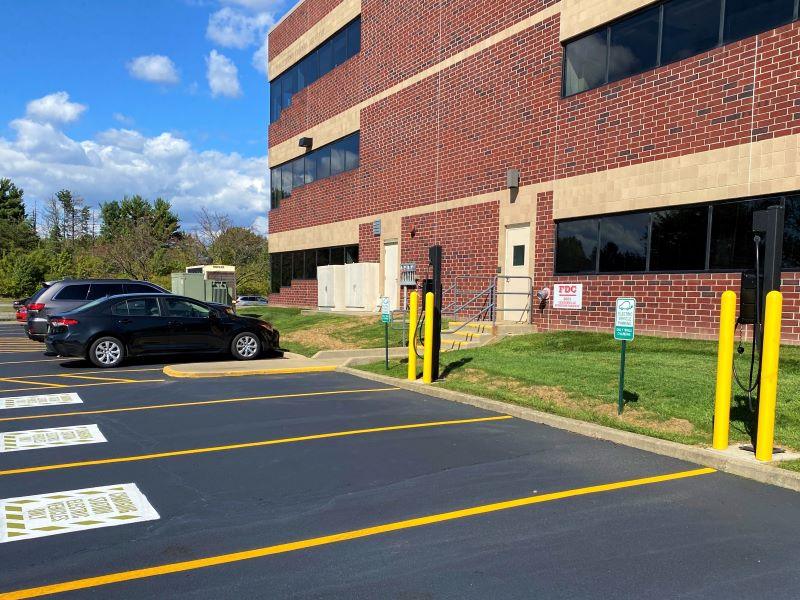
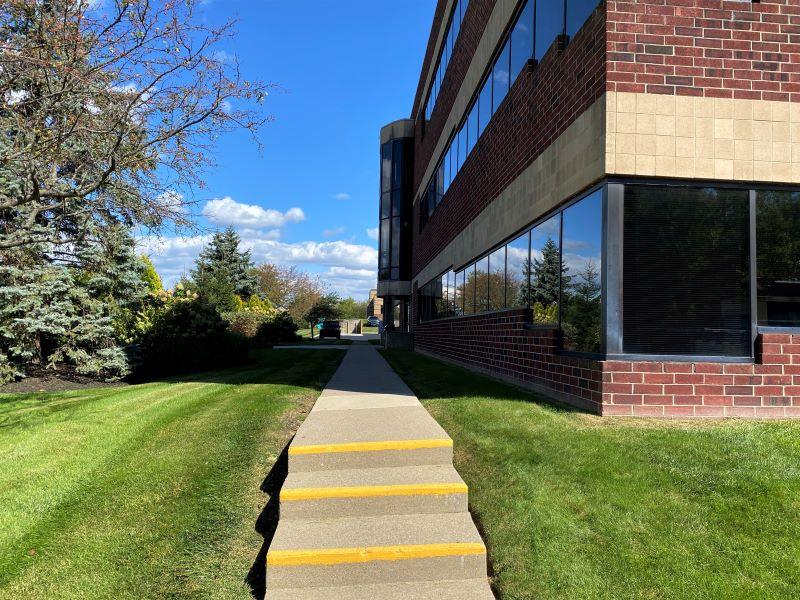
Additional Photos


Listing Agents

Tony Taylor
O: 937-222-1600
M: 937-776-0419
ast@crestrealtyohio.com
O: 937-222-1600
M: 937-776-0419
ast@crestrealtyohio.com
While we strive to provide the most accurate information, all listing information, and demographic data, is provided by third-parties. As such, MyEListing will not be responsible for the accuracy of the information. It is strongly recommended that you verify all information with the listing agent, and any relevant agencies, prior to making any decisions.


