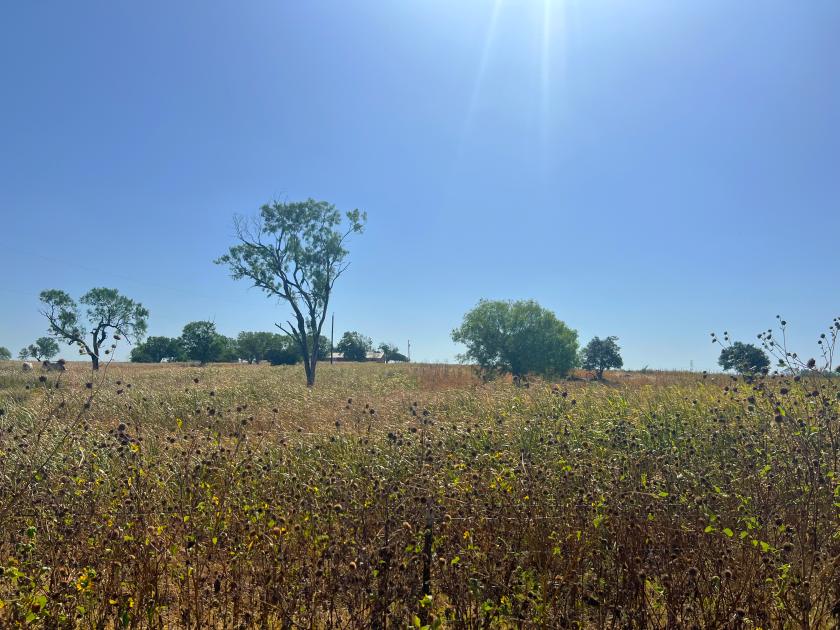
1-Mile | 3-Miles | 5-Miles | ||
---|---|---|---|---|
Total Population | 222 | 3,293 | 26,998 | |
Population Median Age | 41 | 37 | 35 | |
Population by Age | 0-9 Yrs | 31 (13%) | 602 (18%) | 4178 (15%) |
10-19 Yrs | 20 (9%) | 317 (9%) | 4358 (16%) | |
20-29 Yrs | 22 (9%) | 477 (14%) | 3565 (13%) | |
30-39 Yrs | 32 (14%) | 458 (13%) | 3963 (14%) | |
40-49 Yrs | 16 (7%) | 276 (8%) | 2884 (10%) | |
50-59 Yrs | 46 (20%) | 543 (16%) | 3791 (14%) | |
60-69 Yrs | 40 (18%) | 356 (10%) | 2428 (8%) | |
70+ Yrs | 15 (6%) | 265 (8%) | 1832 (6%) | |
Median HH Income | $60,000 | $57,682 | $62,124 | |
Total Household Income | < 24K | 7 (10%) | 150 (15%) | 1418 (18%) |
25-49K | 23 (33%) | 308 (31%) | 1831 (23%) | |
50-74K | 11 (16%) | 127 (12%) | 1800 (23%) | |
75-99K | 4 (5%) | 100 (10%) | 887 (11%) | |
100-199K | 21 (30%) | 284 (28%) | 1687 (21%) | |
200K+ | 1 (1%) | 17 (1%) | 172 (2%) | |
Highest Education Level | No Diploma | 24 | 341 | 2829 |
Diploma or GED | 71 | 804 | 5827 | |
Some College | 36 | 418 | 4318 | |
Assoc. Degree | 11 | 213 | 1542 | |
Bachelors Degree | 11 | 182 | 1584 | |
Higher Degree | 9 | 151 | 985 | |
Total Housing Units | 68 | 1,004 | 8,431 | |
--Owner-Occupied | 56 | 804 | 6,019 | |
--Renter-Occupied | 12 | 184 | 1,776 | |
Owner-Occupied Values | < 100K | 16 | 159 | 1843 |
100-199K | 16 | 309 | 2663 | |
200-299K | 17 | 227 | 1113 | |
300-399K | 4 | 75 | 209 | |
400-499K | 0 | 7 | 51 | |
500K+ | 2 | 27 | 140 | |
Total Working Age Population | 177 | 2,471 | 20,053 | |
In Work Force | 93 | 1,522 | 12,227 | |
Not In Work Force | 84 | 949 | 7,826 | |
Workforce Employed | 88 | 1,456 | 11,412 | |
Workforce Unemployed | 5 | 66 | 803 | |
Civlian Workforce | 93 | 1,522 | 12,214 | |
Military Workforce | 0 | 0 | 13 | |
Total Households | 68 | 987 | 7,795 | |
Family Households | 55 | 767 | 6,247 | |
Non-Family Households | 13 | 220 | 1,548 | |
Married Couple | 46 | 668 | 4,358 | |
Other Family | 9 | 99 | 1,890 | |
Married w/Child | 8 | 221 | 1,854 | |
Single Male w/Child | 3 | 17 | 194 | |
Single Female w/Child | 0 | 17 | 804 |
Population Change Last Two Decades - Plus Projection
2000 | % | 2010 | % | 2020 | % | 2030 | |
---|---|---|---|---|---|---|---|
Texas | 20,851,820 | +21 | 25,145,561 | +18 | 29,677,668 | +18 | 34,894,452 |
Bexar County | 1,392,931 | +23 | 1,714,773 | +22 | 2,093,502 | +20 | 2,502,617 |
Total Working Age Population:
Total Households:
Total Working Age Population:
Total Households:
Total Working Age Population:
Total Households: