Commercial Land
Mormon Mill Rd Marble Falls, TX 78654
Mormon Mill Rd Marble Falls, TX 78654
Details & Description
Property Highlights
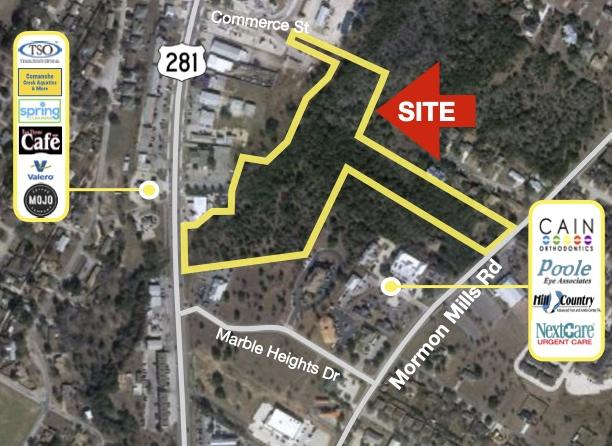
• Frontage on Mormon Mill, Commerce Street and Hwy 281
• All utilities avaialble
Listing Agents

Spencer Collins
O: 512-536-7829
M: 512-789-0909
spence@matexas.com
O: 512-536-7829
M: 512-789-0909
spence@matexas.com
While we strive to provide the most accurate information, all listing information, and demographic data, is provided by third-parties. As such, MyEListing will not be responsible for the accuracy of the information. It is strongly recommended that you verify all information with the listing agent, and any relevant agencies, prior to making any decisions.


