Commercial Land
17097 Nacogdoches Road San Antonio, TX 78266
17097 Nacogdoches Road San Antonio, TX 78266

Details & Description
Property Highlights
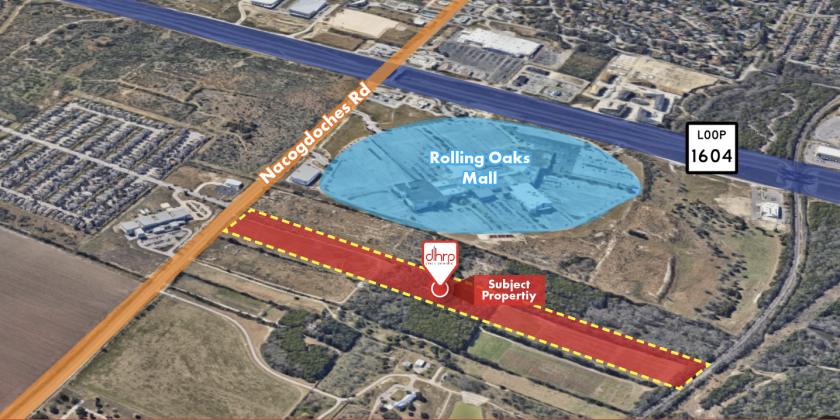
- • Approximately ±25.367 AC
- • Easy access to Loop 1604 and I-35
- • Located in rapidly developing area
- • All utilities at or near site
Additional Photos


Listing Agents

Matthew Baylor
O: 210-222-2424
M: 210-381-3398
mbaylor@dhrp.us
O: 210-222-2424
M: 210-381-3398
mbaylor@dhrp.us

Logan Baylor
DH Realty Partners
O: 210-222-2424
M: 210-326-1095
lbaylor@dhrp.us
DH Realty Partners
O: 210-222-2424
M: 210-326-1095
lbaylor@dhrp.us
While we strive to provide the most accurate information, all listing information, and demographic data, is provided by third-parties. As such, MyEListing will not be responsible for the accuracy of the information. It is strongly recommended that you verify all information with the listing agent, and any relevant agencies, prior to making any decisions.