Office Space
14044 Spring Cypress Road Cypress, TX 77429
14044 Spring Cypress Road Cypress, TX 77429
Details & Description
Property Highlights
• Attractive Credit Tenant: Houston Methodist received an “AA” bond rating from the S&P in 2020
• Brand New Lease: New 7-year lease with 3% annual increases that commenced January 1, 2023
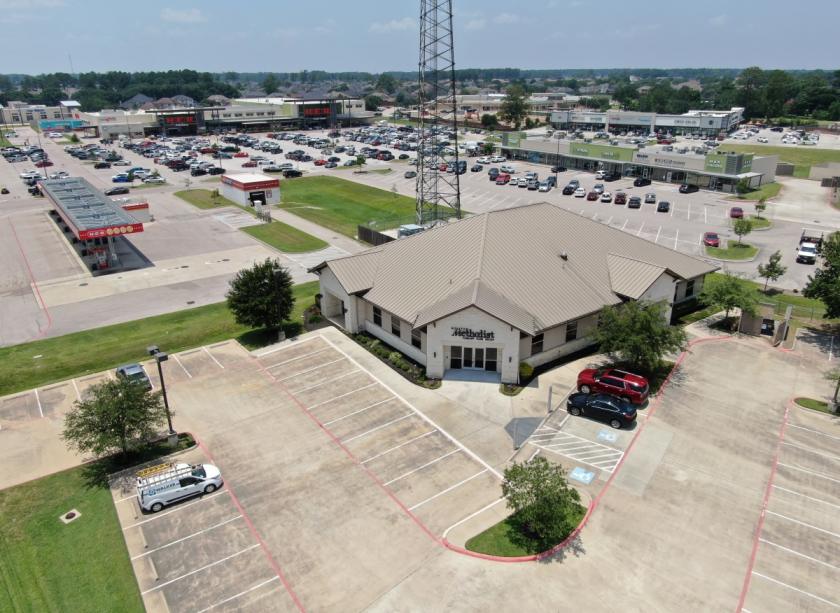
Additional Photos


Listing Agents

Todd Moore
O: 713-830-2191
M: 832-725-1567
todd.moore@colliers.com
O: 713-830-2191
M: 832-725-1567
todd.moore@colliers.com
While we strive to provide the most accurate information, all listing information, and demographic data, is provided by third-parties. As such, MyEListing will not be responsible for the accuracy of the information. It is strongly recommended that you verify all information with the listing agent, and any relevant agencies, prior to making any decisions.


