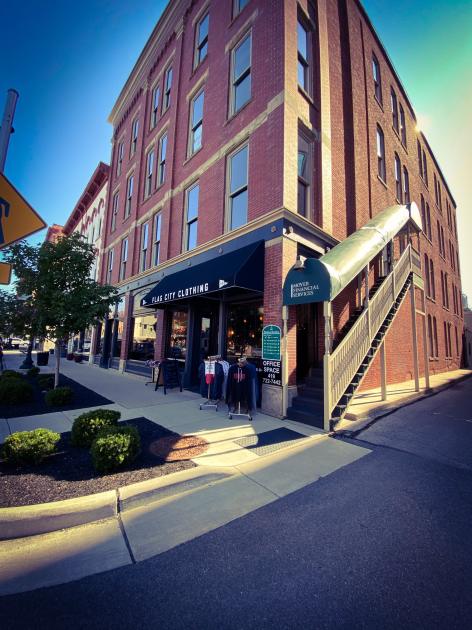
Office Space
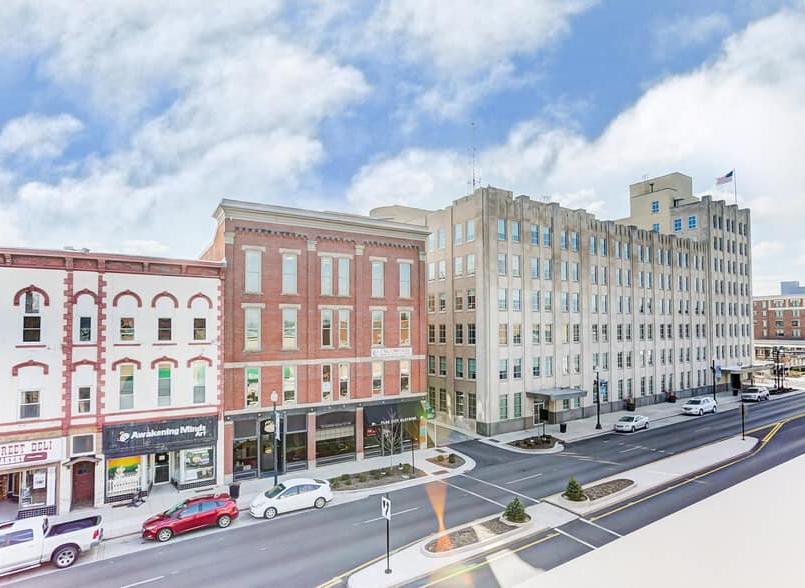
521 South Main Street Findlay, OH 45840
521 South Main Street Findlay, OH 45840
Details & Description
Property Highlights
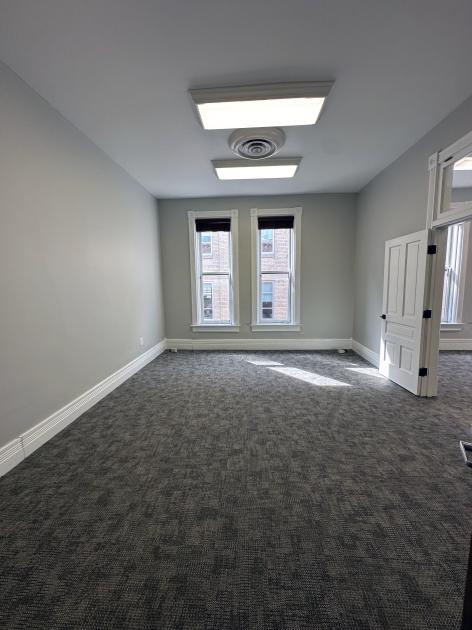
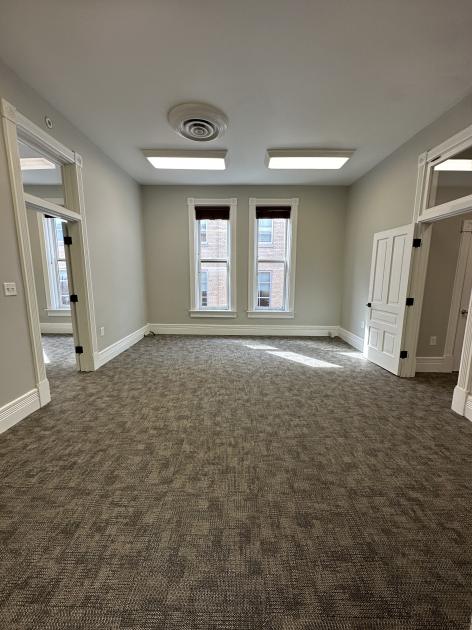
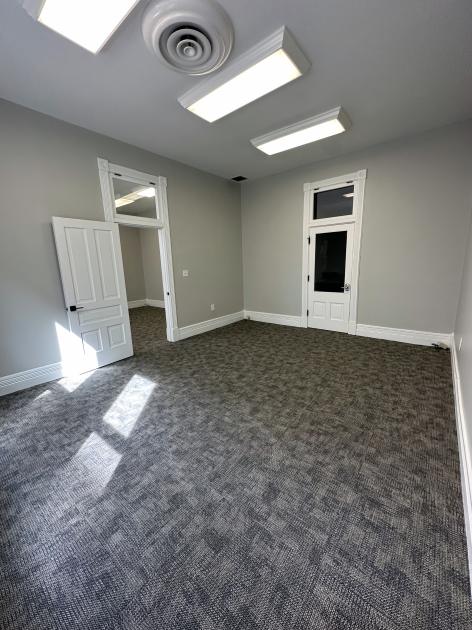
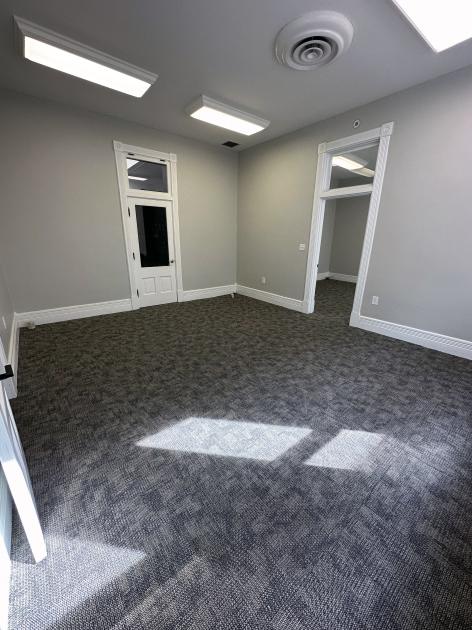
- • 1. Two (2) Offices that measures
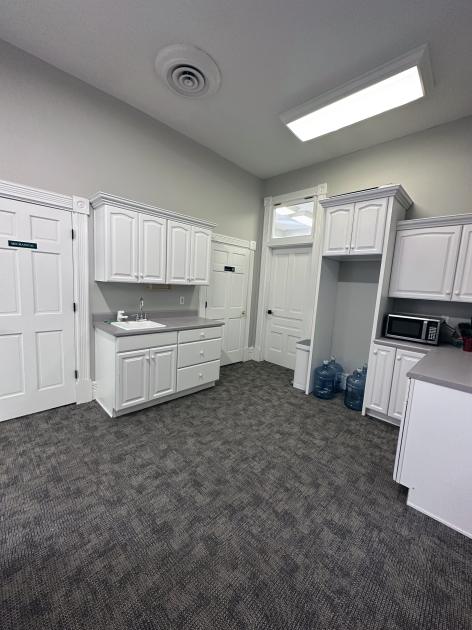
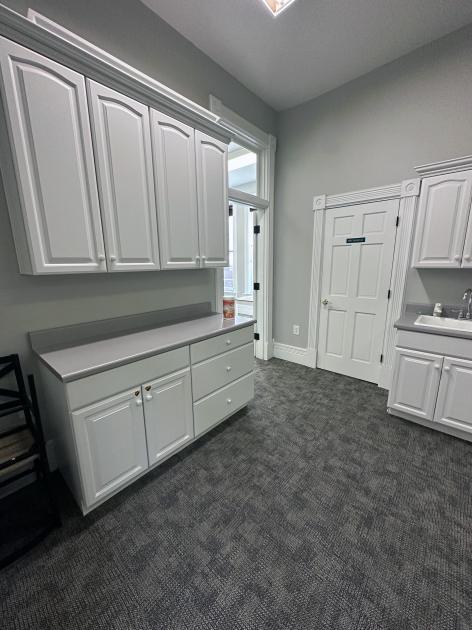
- • 2. One (1) Break Room that measures
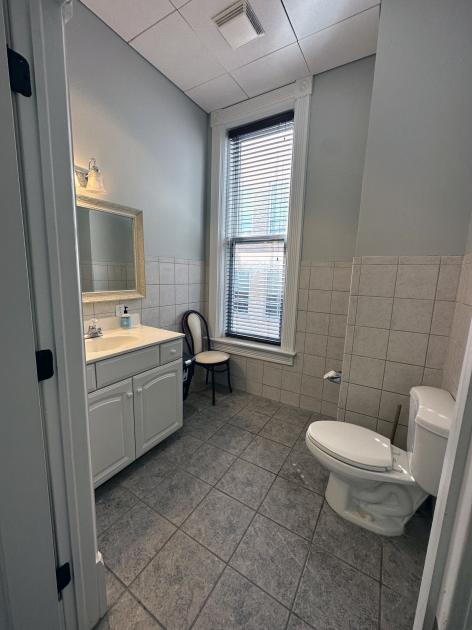
- • 3. One (1) Bathroom that measures
- • 4. Keyless Entry Into Building / Offices
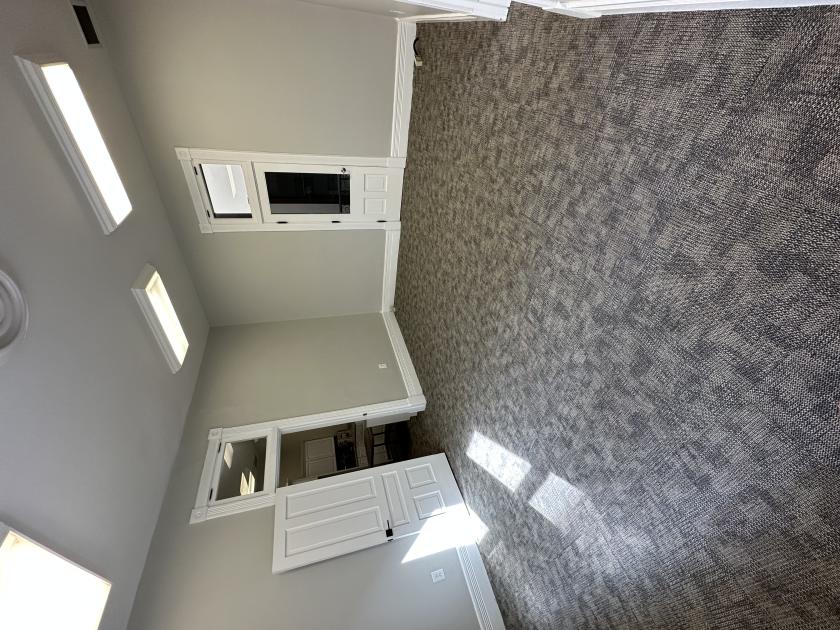
- • 5. Brand new carpet and Fresh Paint
- • 6. All Utilities Included In Lease Price
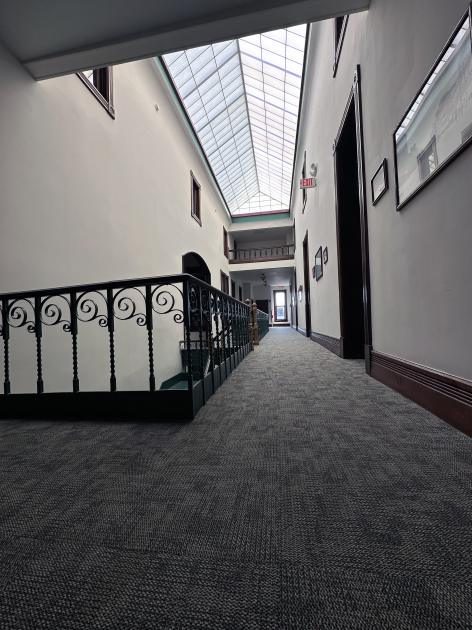
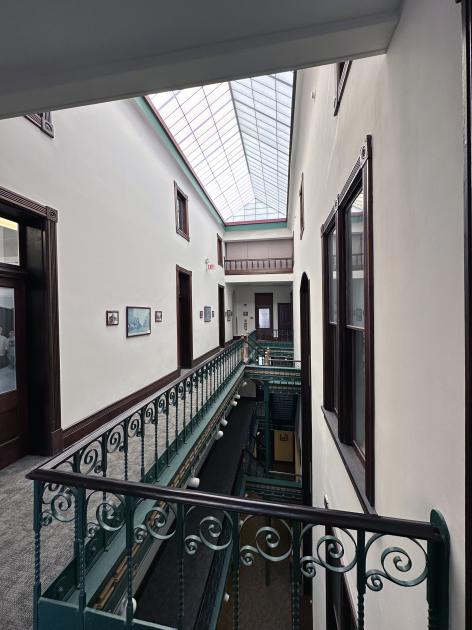
Additional Photos
Listing Agents

Nicholas Moore
nick@invoguerecords.com
nick@invoguerecords.com
While we strive to provide the most accurate information, all listing information, and demographic data, is provided by third-parties. As such, MyEListing will not be responsible for the accuracy of the information. It is strongly recommended that you verify all information with the listing agent, and any relevant agencies, prior to making any decisions.