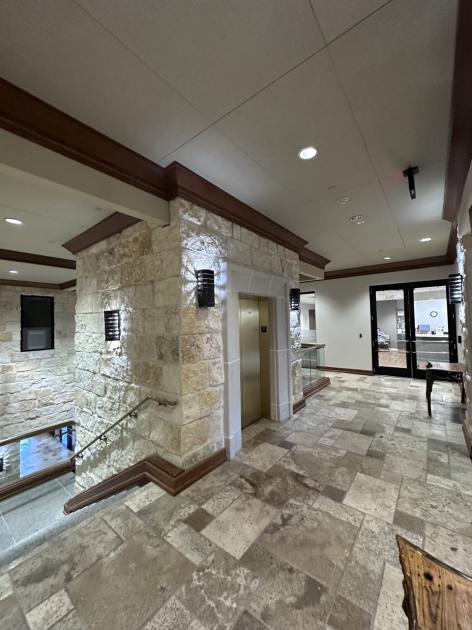
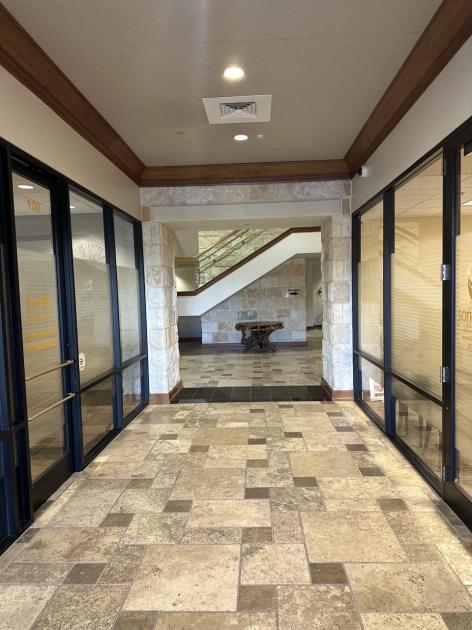
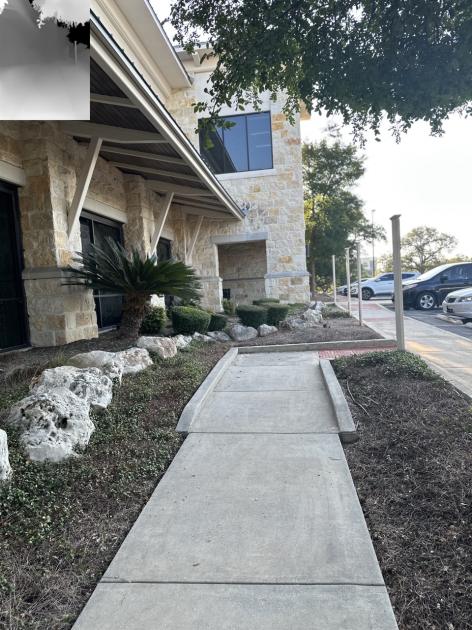
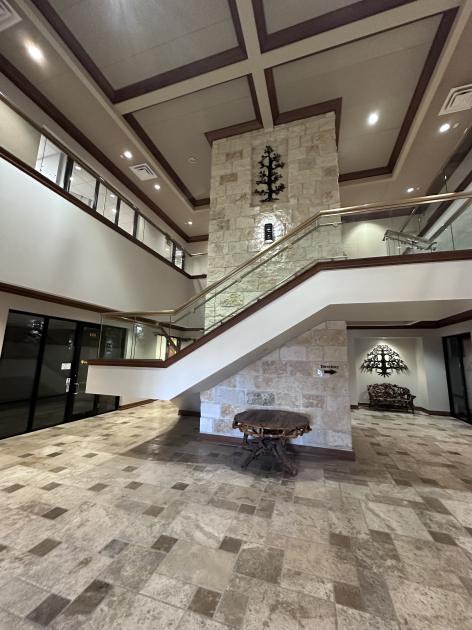
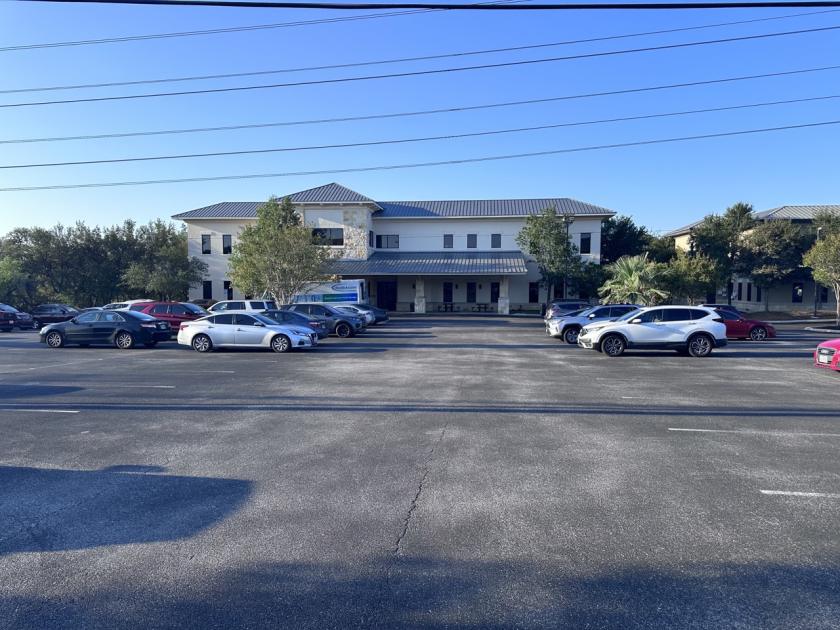
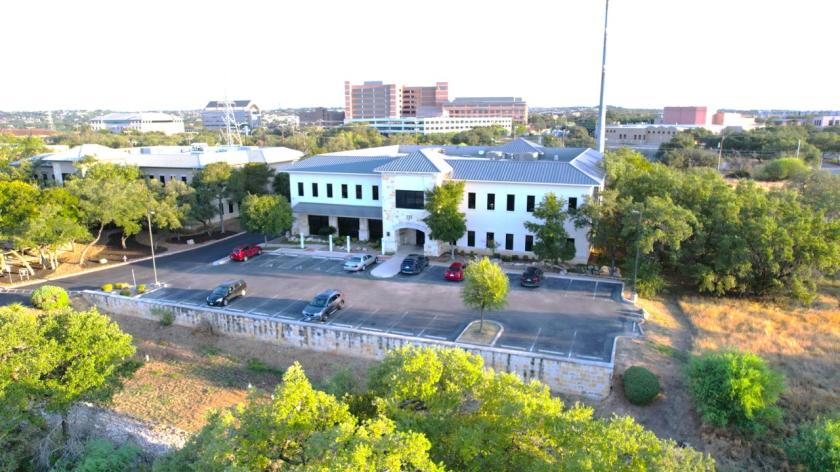
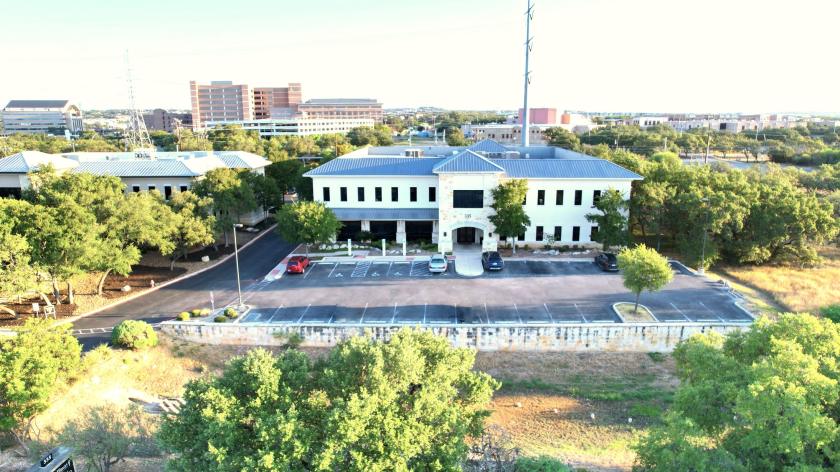
1-Mile | 3-Miles | 5-Miles | ||
---|---|---|---|---|
Total Population | 7,363 | 77,779 | 190,587 | |
Population Median Age | 45 | 38 | 38 | |
Population by Age | 0-9 Yrs | 799 (10%) | 9930 (12%) | 23471 (12%) |
10-19 Yrs | 523 (7%) | 10572 (13%) | 26169 (13%) | |
20-29 Yrs | 905 (12%) | 9414 (12%) | 24580 (12%) | |
30-39 Yrs | 1012 (13%) | 12358 (15%) | 27564 (14%) | |
40-49 Yrs | 799 (10%) | 10726 (13%) | 26998 (14%) | |
50-59 Yrs | 1000 (13%) | 9664 (12%) | 24599 (12%) | |
60-69 Yrs | 639 (8%) | 7206 (9%) | 19336 (10%) | |
70+ Yrs | 1686 (22%) | 7910 (10%) | 17871 (9%) | |
Median HH Income | $85,401 | $91,735 | $86,774 | |
Total Household Income | < 24K | 448 (13%) | 2570 (8%) | 7391 (10%) |
25-49K | 679 (20%) | 5069 (17%) | 12750 (17%) | |
50-74K | 307 (9%) | 4121 (14%) | 10852 (15%) | |
75-99K | 488 (14%) | 4136 (14%) | 9805 (13%) | |
100-199K | 963 (29%) | 9455 (32%) | 21106 (29%) | |
200K+ | 390 (11%) | 3707 (12%) | 9320 (13%) | |
Highest Education Level | No Diploma | 238 | 2185 | 5256 |
Diploma or GED | 554 | 6068 | 18314 | |
Some College | 1036 | 10856 | 27062 | |
Assoc. Degree | 901 | 4931 | 11202 | |
Bachelors Degree | 1869 | 18436 | 42165 | |
Higher Degree | 1023 | 10677 | 25895 | |
Total Housing Units | 3,488 | 30,679 | 75,754 | |
--Owner-Occupied | 1,425 | 17,345 | 43,228 | |
--Renter-Occupied | 1,849 | 11,713 | 27,996 | |
Owner-Occupied Values | < 100K | 105 | 400 | 1116 |
100-199K | 23 | 942 | 4918 | |
200-299K | 306 | 6687 | 16057 | |
300-399K | 517 | 5310 | 11040 | |
400-499K | 302 | 2265 | 5009 | |
500K+ | 173 | 1742 | 5088 | |
Total Working Age Population | 6,213 | 61,094 | 150,925 | |
In Work Force | 3,561 | 41,356 | 103,417 | |
Not In Work Force | 2,652 | 19,738 | 47,508 | |
Workforce Employed | 3,467 | 39,426 | 98,479 | |
Workforce Unemployed | 76 | 1,508 | 3,988 | |
Civlian Workforce | 3,543 | 40,935 | 102,467 | |
Military Workforce | 19 | 421 | 950 | |
Total Households | 3,274 | 29,058 | 71,224 | |
Family Households | 1,765 | 19,004 | 46,286 | |
Non-Family Households | 1,509 | 10,054 | 24,938 | |
Married Couple | 1,489 | 15,634 | 37,750 | |
Other Family | 277 | 3,370 | 8,537 | |
Married w/Child | 444 | 6,462 | 15,534 | |
Single Male w/Child | 22 | 234 | 949 | |
Single Female w/Child | 85 | 1,859 | 3,929 |
Population Change Last Two Decades - Plus Projection
2000 | % | 2010 | % | 2020 | % | 2030 | |
---|---|---|---|---|---|---|---|
Texas | 20,851,820 | +21 | 25,145,561 | +18 | 29,677,668 | +18 | 34,894,452 |
Bexar County | 1,392,931 | +23 | 1,714,773 | +22 | 2,093,502 | +20 | 2,502,617 |
Total Working Age Population:
Total Households:
Total Working Age Population:
Total Households:
Total Working Age Population:
Total Households: