Industrial Properties
103 Thomas Road Big Spring, TX 79720
103 Thomas Road Big Spring, TX 79720

Details & Description
Property Highlights
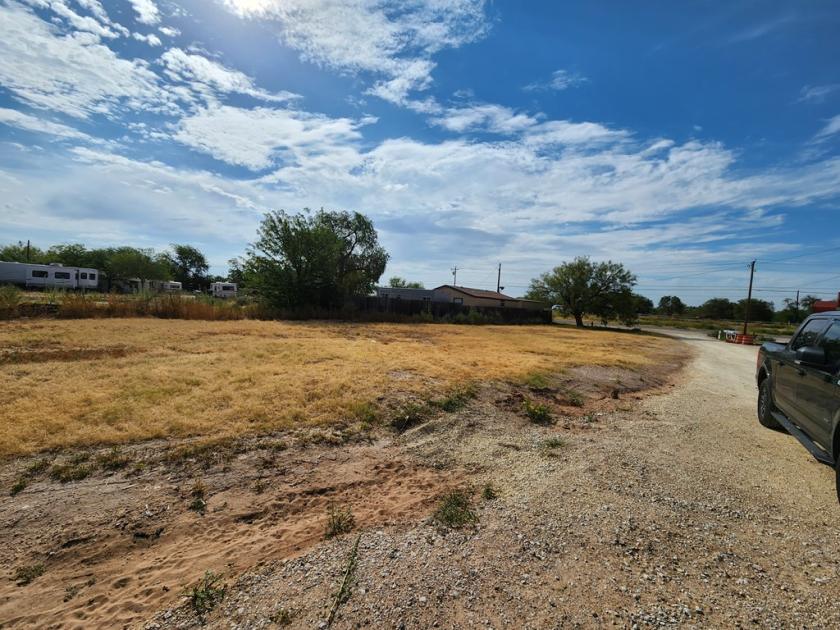
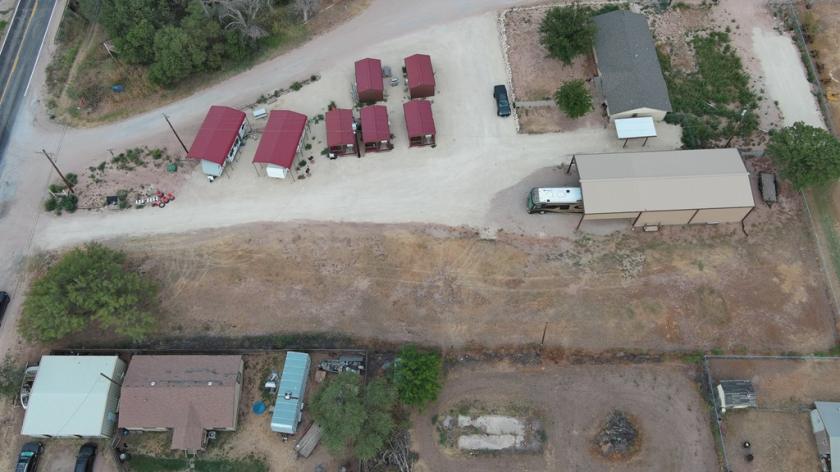
- • Conveniently Located
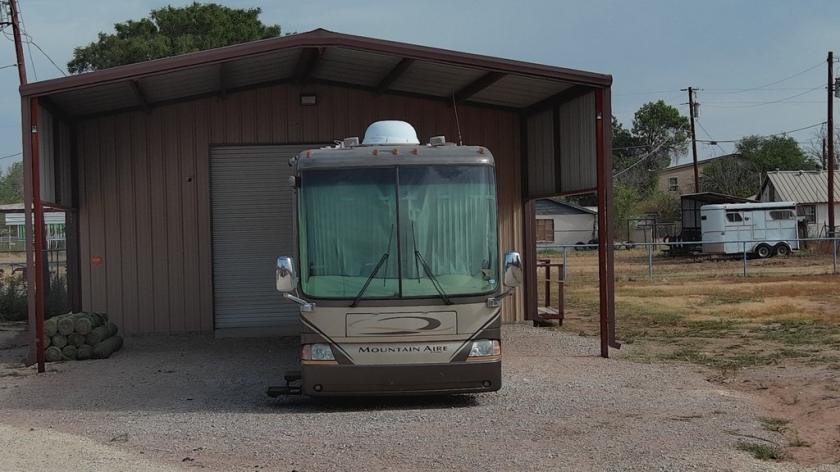
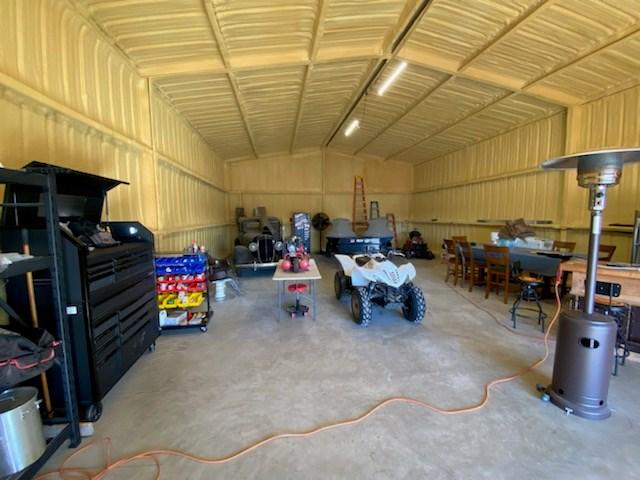
- • Fantastic New Shop
- • Lots of Value
- • Priced to Sell
- • Must See Property
Additional Photos


Listing Agents

Thomas Johnston
O: 432-934-3333
M: 432-688-8200
rertexas@gmail.com
O: 432-934-3333
M: 432-688-8200
rertexas@gmail.com
While we strive to provide the most accurate information, all listing information, and demographic data, is provided by third-parties. As such, MyEListing will not be responsible for the accuracy of the information. It is strongly recommended that you verify all information with the listing agent, and any relevant agencies, prior to making any decisions.