Commercial Land
2002 North County Road 1130 Midland, TX 79706
2002 North County Road 1130 Midland, TX 79706

Details & Description
Property Highlights
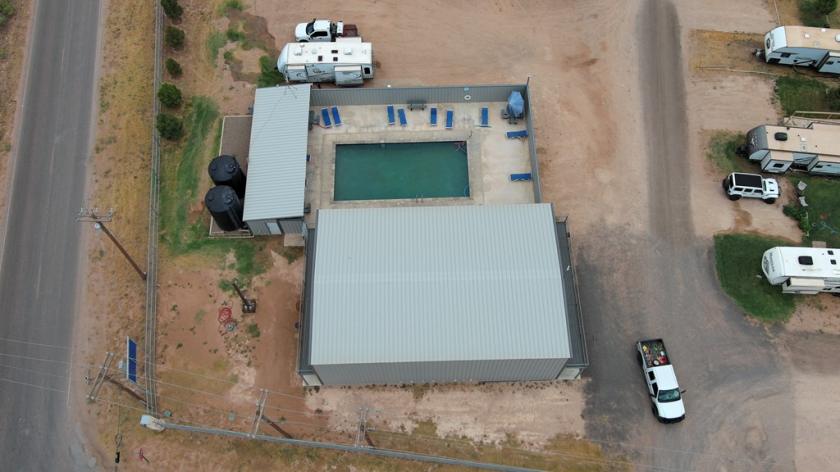
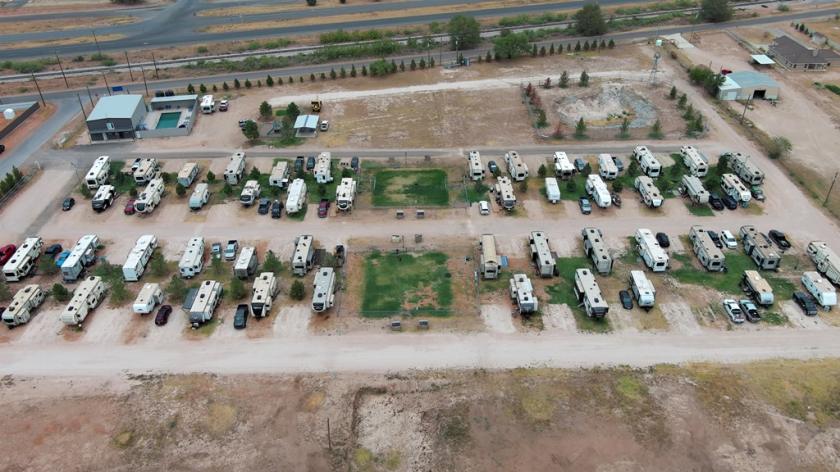
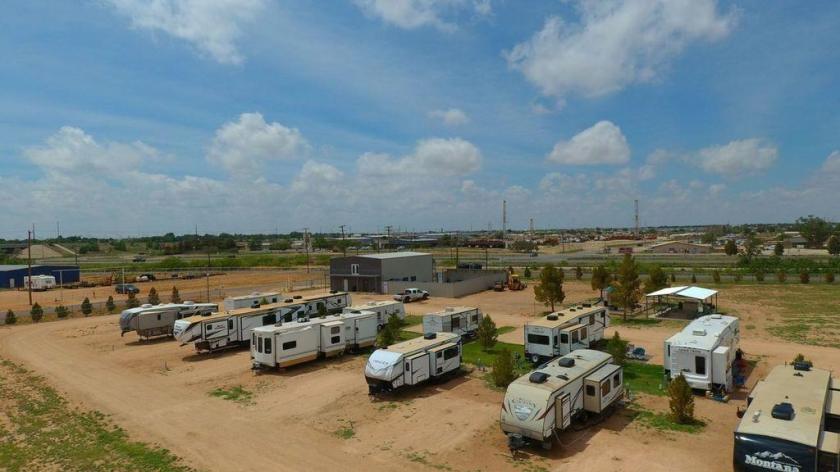
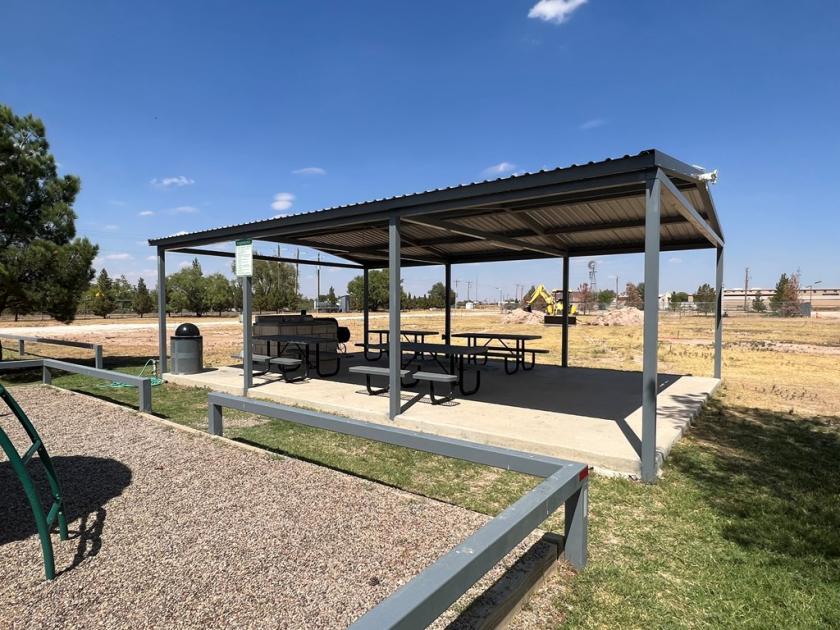
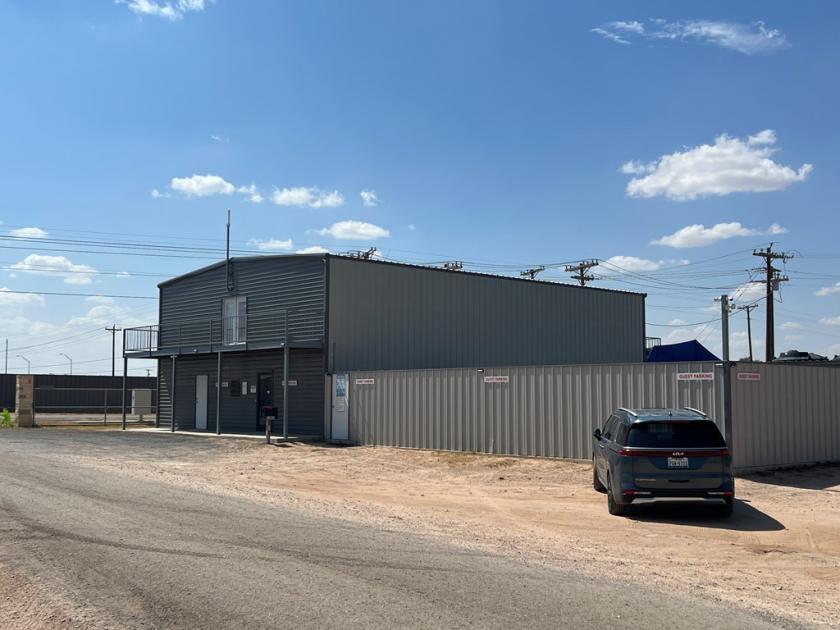
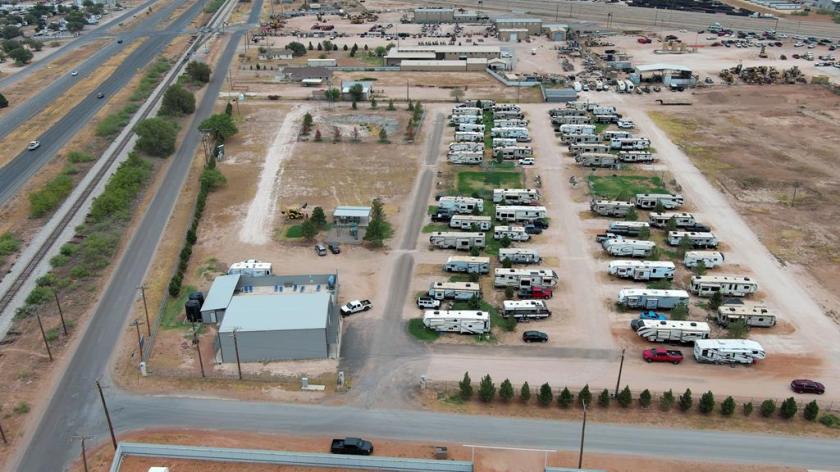
- • 12.87 Acres
- • 52 RV spots currently
- • Planned for 104 RV spots
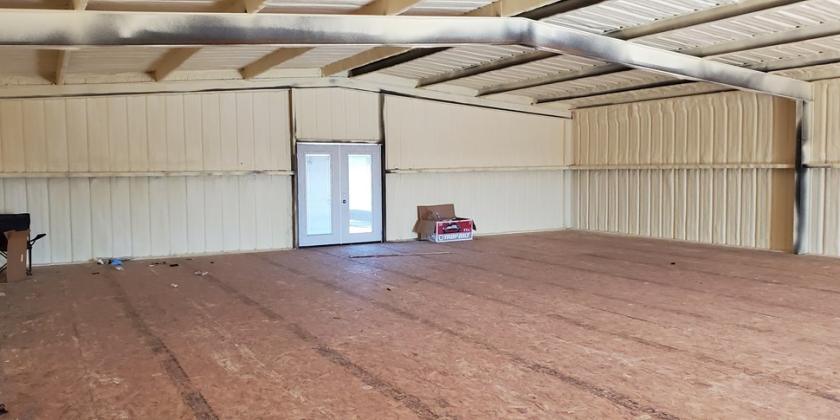
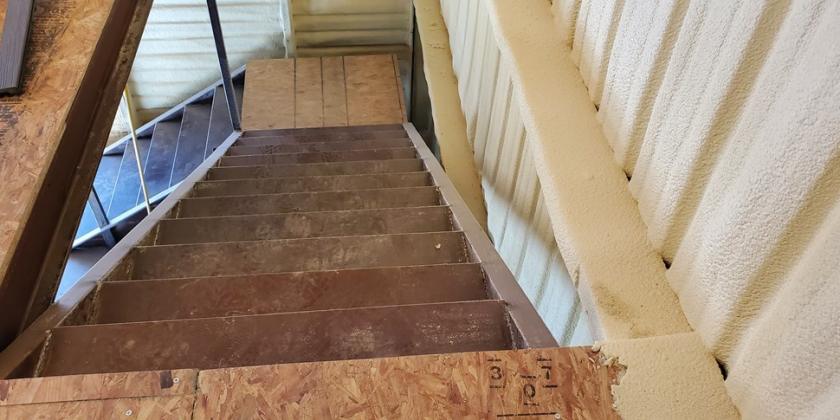
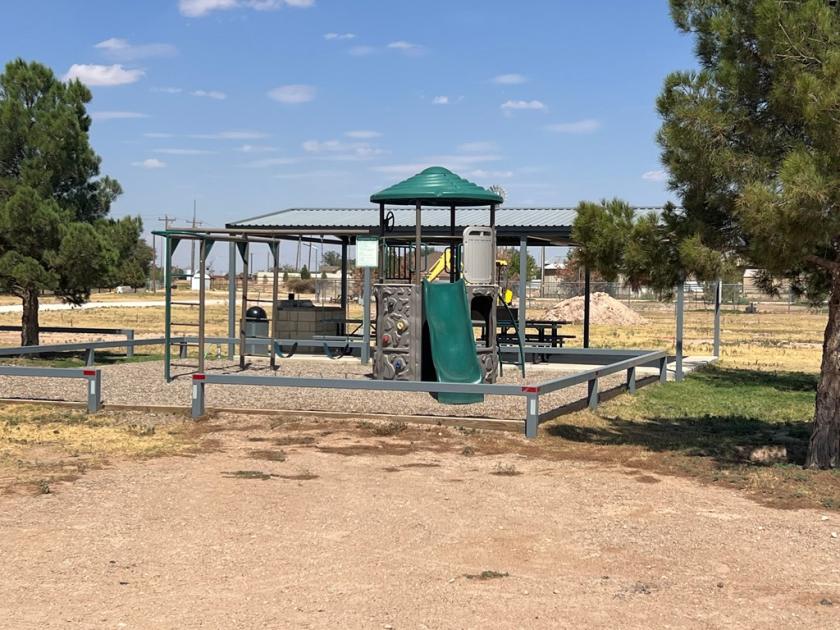
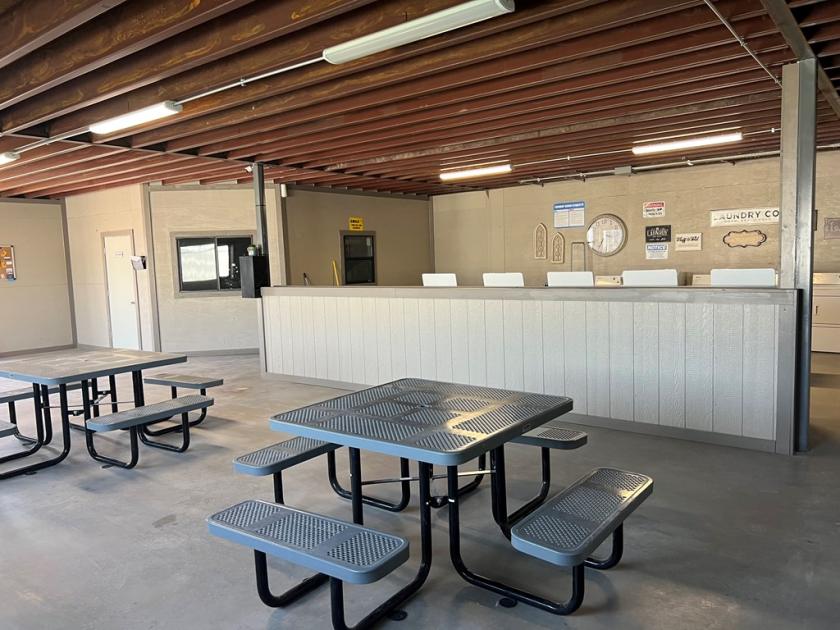
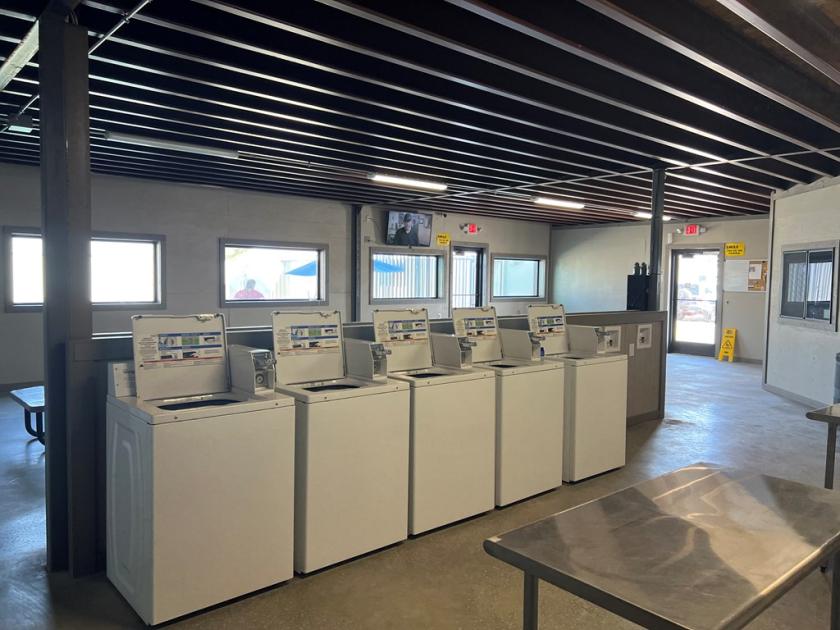
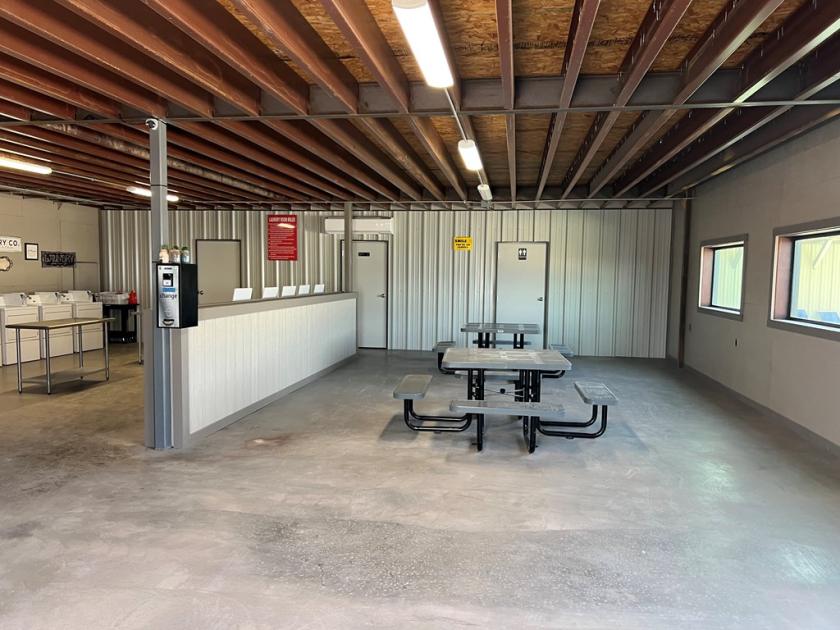
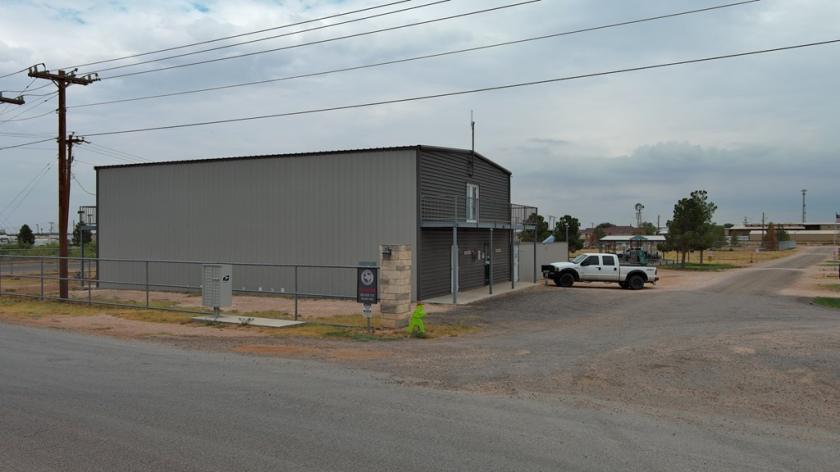
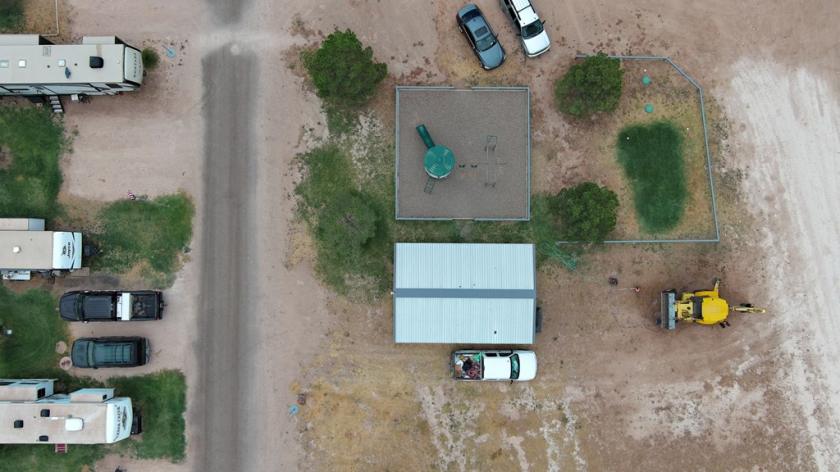
- • So Many Amenities
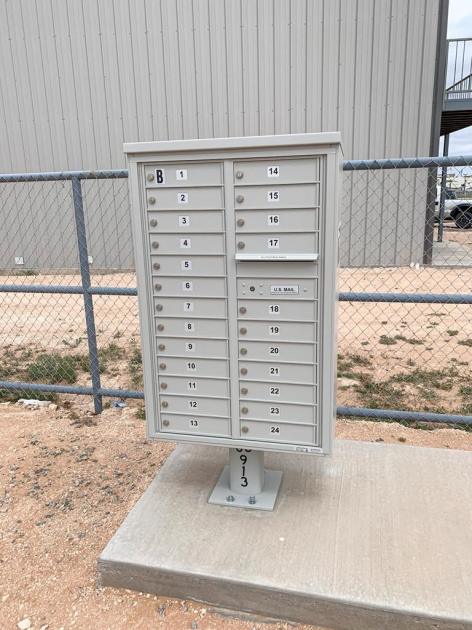
- • Mailbox service provided for long-term tenants
- • AMAZING Price
Additional Photos

Listing Agents

Thomas Johnston
O: 432-934-3333
M: 432-688-8200
rertexas@gmail.com
O: 432-934-3333
M: 432-688-8200
rertexas@gmail.com
While we strive to provide the most accurate information, all listing information, and demographic data, is provided by third-parties. As such, MyEListing will not be responsible for the accuracy of the information. It is strongly recommended that you verify all information with the listing agent, and any relevant agencies, prior to making any decisions.