Industrial Properties
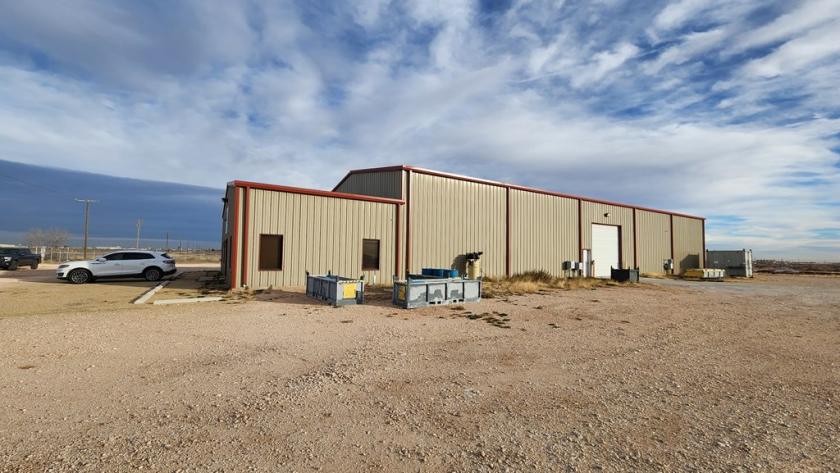
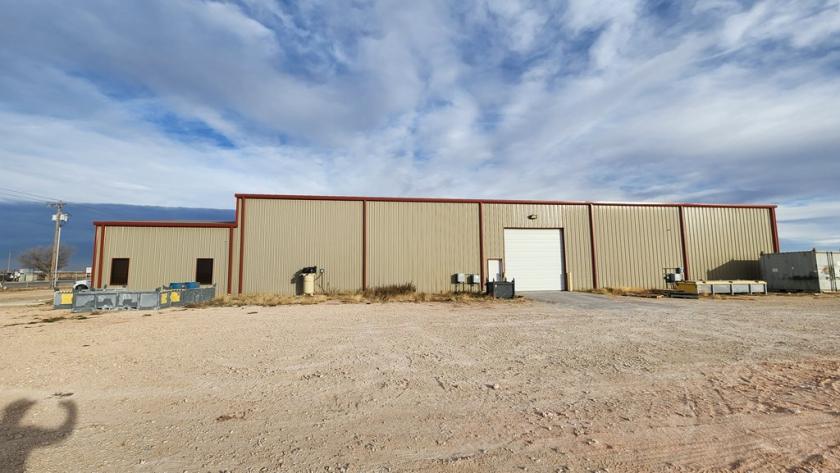
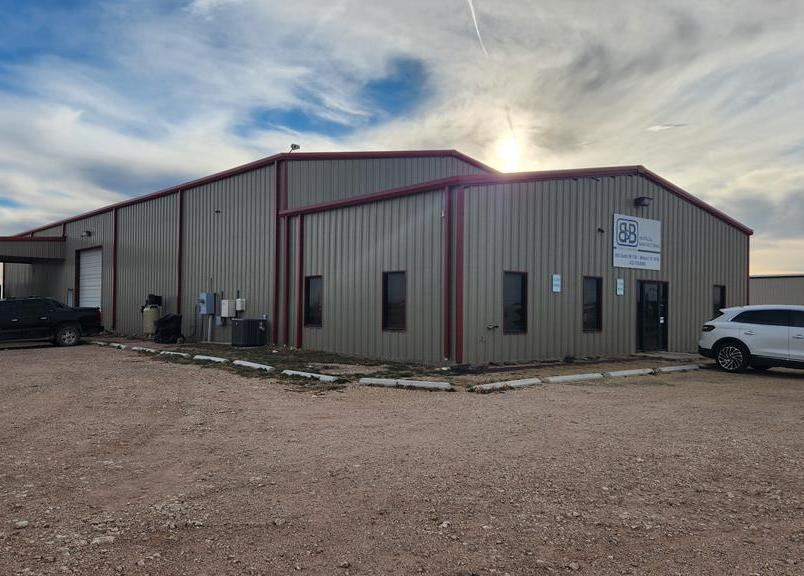
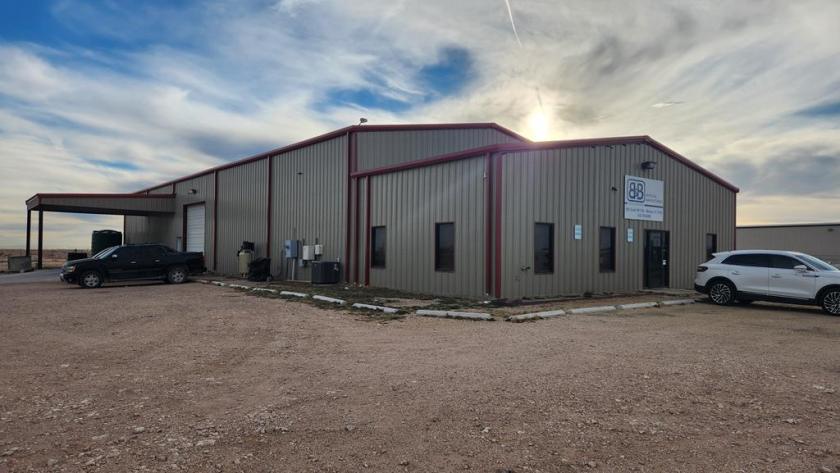
5505 Farm to Market 1788 Midland, TX 79706
5505 Farm to Market 1788 Midland, TX 79706
Details & Description
Property Highlights
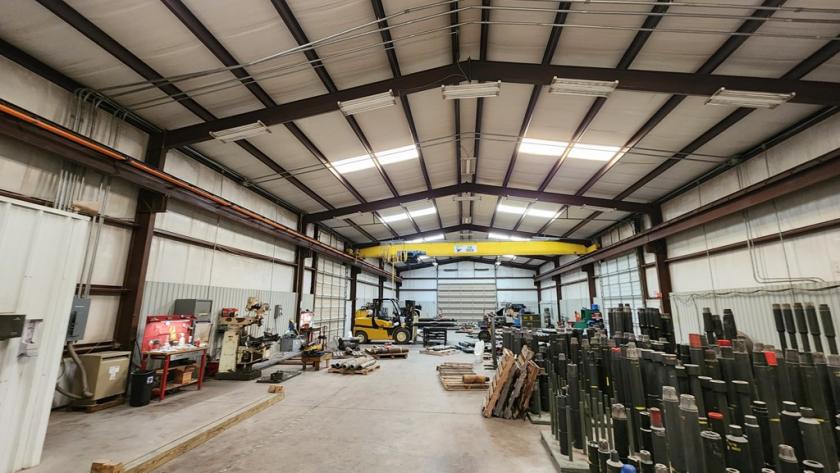
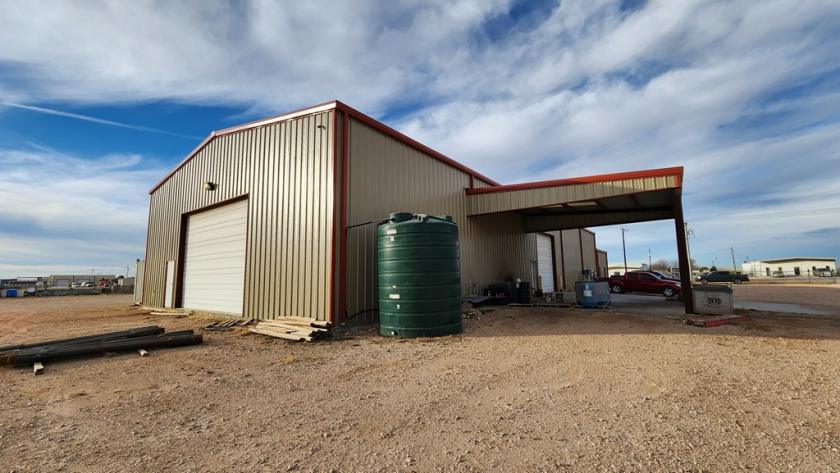
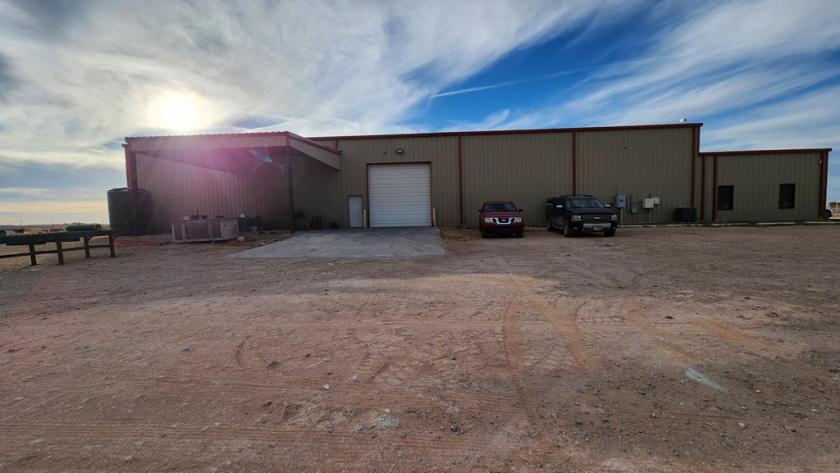
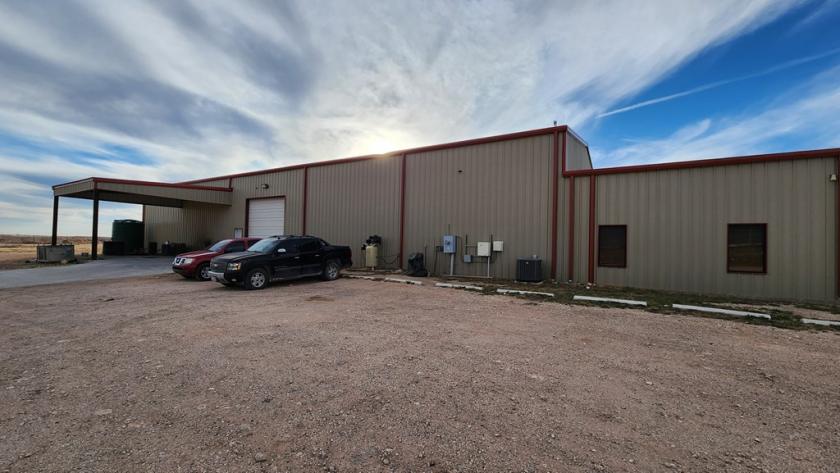
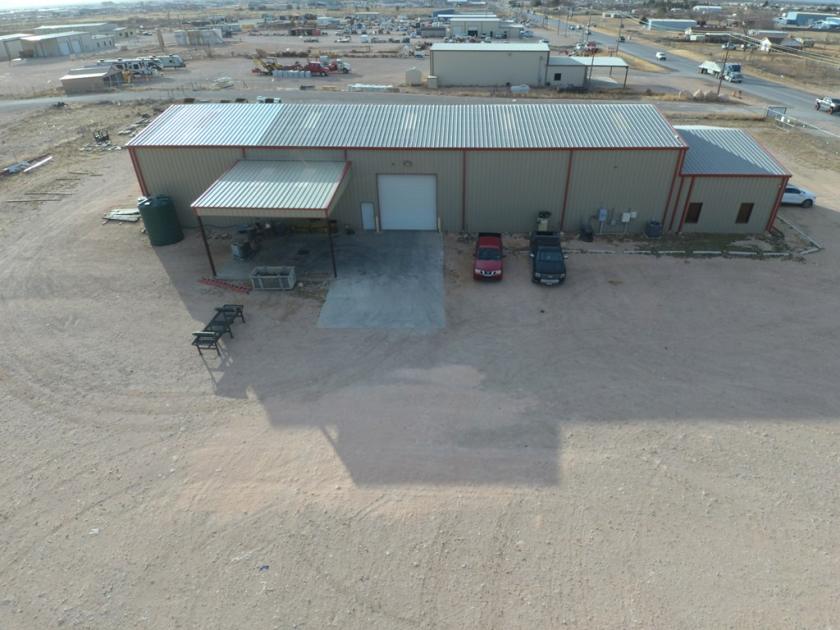
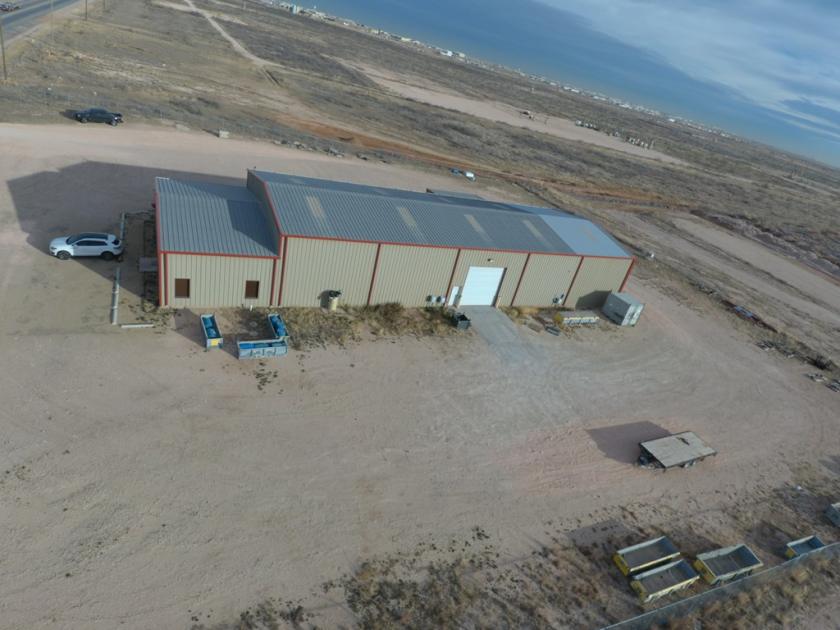
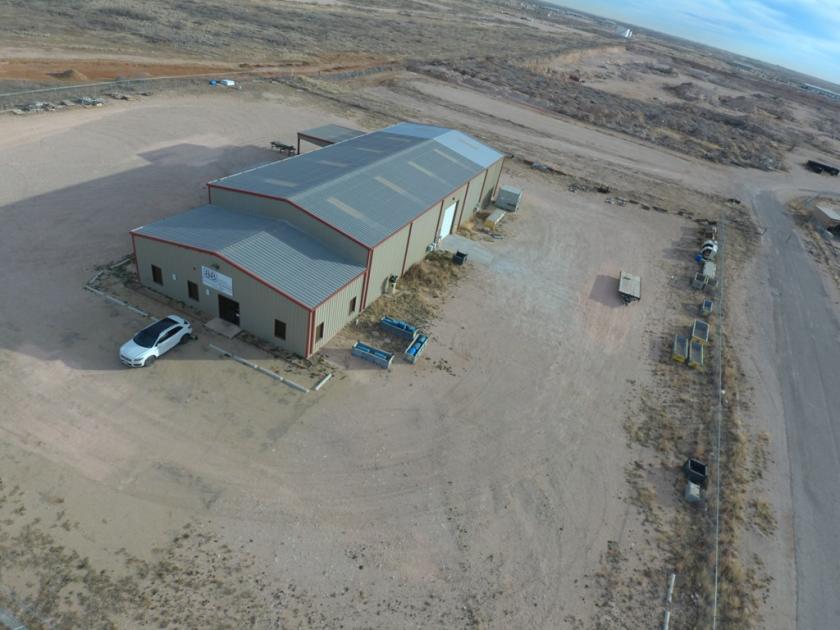
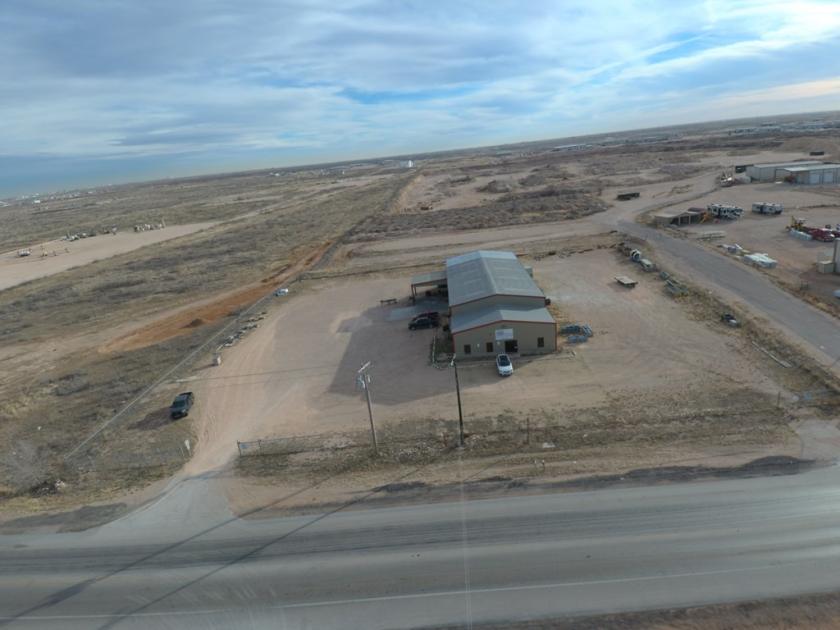
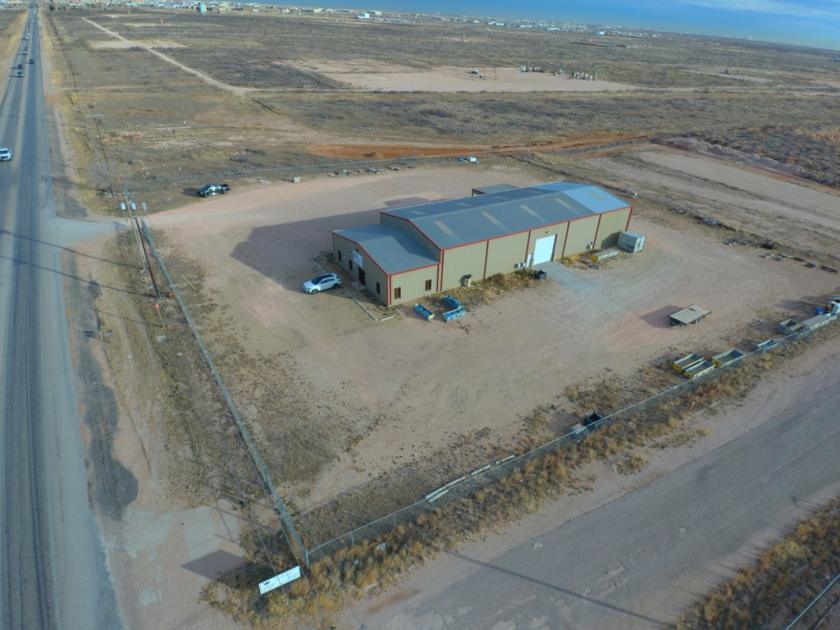
- • 6250 Sq Ft Warehouse
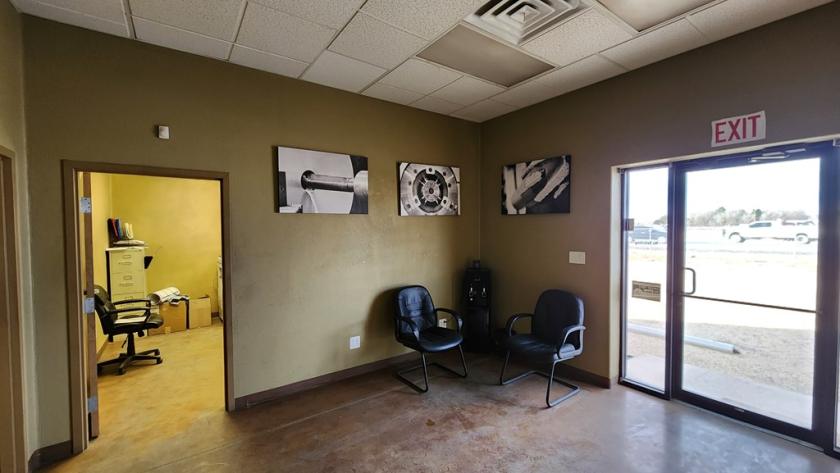
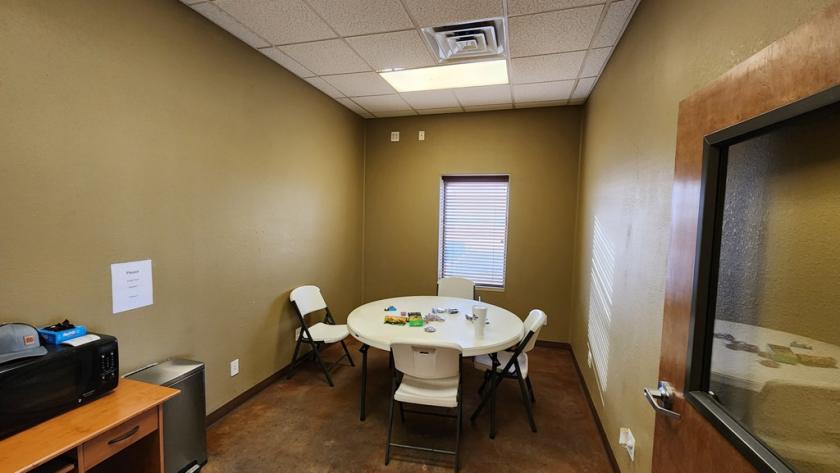
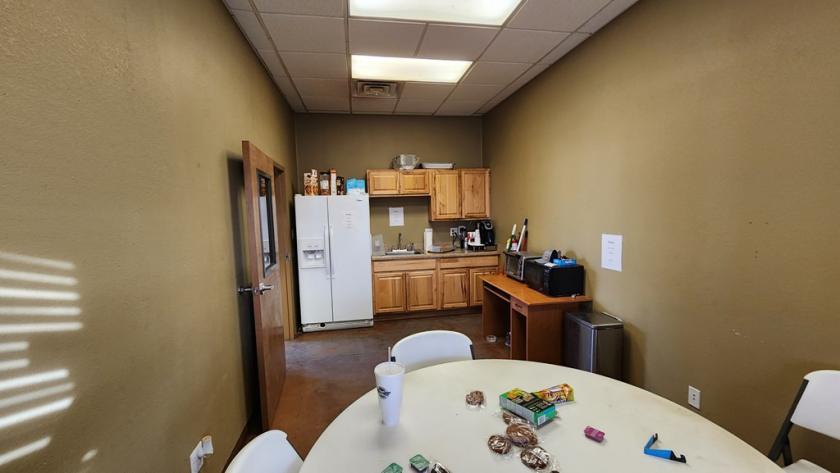
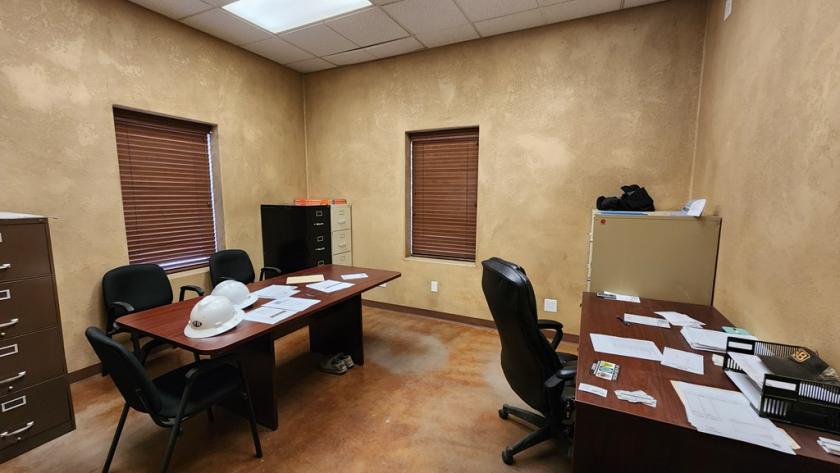
- • 1250 Sq Ft Office
- • 650 Sq Ft Covered Washbay
- • 10 Ton Crane
- • 3 Phase 480/V
- • Fantastic Location
Additional Photos
Listing Agents

Thomas Johnston
O: 432-934-3333
M: 432-688-8200
rertexas@gmail.com
O: 432-934-3333
M: 432-688-8200
rertexas@gmail.com
While we strive to provide the most accurate information, all listing information, and demographic data, is provided by third-parties. As such, MyEListing will not be responsible for the accuracy of the information. It is strongly recommended that you verify all information with the listing agent, and any relevant agencies, prior to making any decisions.