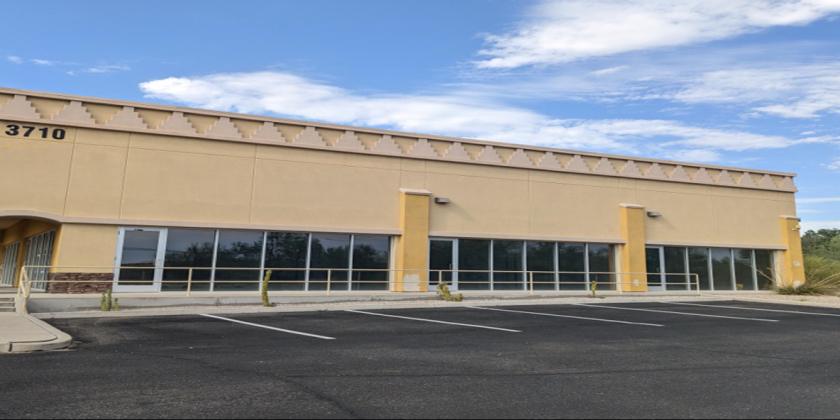
1-Mile | 3-Miles | 5-Miles | ||
---|---|---|---|---|
Total Population | 6,854 | 54,719 | 119,816 | |
Population Median Age | 40 | 40 | 42 | |
Population by Age | 0-9 Yrs | 809 (11%) | 5962 (10%) | 12838 (10%) |
10-19 Yrs | 658 (9%) | 6290 (11%) | 13899 (11%) | |
20-29 Yrs | 995 (14%) | 8639 (15%) | 16060 (13%) | |
30-39 Yrs | 1046 (15%) | 6873 (12%) | 14061 (11%) | |
40-49 Yrs | 888 (12%) | 6561 (11%) | 13410 (11%) | |
50-59 Yrs | 907 (13%) | 6613 (12%) | 14502 (12%) | |
60-69 Yrs | 824 (12%) | 7287 (13%) | 17453 (14%) | |
70+ Yrs | 727 (10%) | 6493 (11%) | 17594 (14%) | |
Median HH Income | $75,090 | $73,556 | $75,100 | |
Total Household Income | < 24K | 213 (8%) | 2457 (11%) | 5675 (11%) |
25-49K | 585 (22%) | 4500 (20%) | 9569 (19%) | |
50-74K | 524 (19%) | 4370 (19%) | 8880 (18%) | |
75-99K | 569 (21%) | 4100 (18%) | 7823 (16%) | |
100-199K | 666 (25%) | 5575 (25%) | 13081 (27%) | |
200K+ | 91 (3%) | 1175 (5%) | 3283 (6%) | |
Highest Education Level | No Diploma | 222 | 1684 | 4121 |
Diploma or GED | 1038 | 7471 | 15420 | |
Some College | 1447 | 10764 | 22116 | |
Assoc. Degree | 539 | 4507 | 9025 | |
Bachelors Degree | 962 | 8068 | 19450 | |
Higher Degree | 756 | 5264 | 13959 | |
Total Housing Units | 2,685 | 23,496 | 52,006 | |
--Owner-Occupied | 2,005 | 15,059 | 33,974 | |
--Renter-Occupied | 643 | 7,119 | 14,337 | |
Owner-Occupied Values | < 100K | 41 | 464 | 1722 |
100-199K | 850 | 5531 | 8480 | |
200-299K | 887 | 5851 | 11774 | |
300-399K | 177 | 1708 | 6439 | |
400-499K | 26 | 921 | 3009 | |
500K+ | 23 | 584 | 2550 | |
Total Working Age Population | 5,588 | 45,055 | 98,486 | |
In Work Force | 3,968 | 29,689 | 59,675 | |
Not In Work Force | 1,620 | 15,366 | 38,811 | |
Workforce Employed | 3,709 | 27,888 | 56,195 | |
Workforce Unemployed | 236 | 1,604 | 3,083 | |
Civlian Workforce | 3,945 | 29,492 | 59,278 | |
Military Workforce | 23 | 197 | 396 | |
Total Households | 2,648 | 22,178 | 48,311 | |
Family Households | 1,867 | 14,450 | 31,913 | |
Non-Family Households | 781 | 7,727 | 16,398 | |
Married Couple | 1,327 | 10,455 | 24,513 | |
Other Family | 540 | 3,996 | 7,400 | |
Married w/Child | 403 | 3,390 | 7,755 | |
Single Male w/Child | 33 | 688 | 1,263 | |
Single Female w/Child | 225 | 1,315 | 2,373 |
Population Change Last Two Decades - Plus Projection
2000 | % | 2010 | % | 2020 | % | 2030 | |
---|---|---|---|---|---|---|---|
Arizona | 5,130,632 | +25 | 6,392,017 | +14 | 7,286,100 | +14 | 8,284,900 |
Pima County | 843,746 | +16 | 980,263 | +7 | 1,050,900 | +7 | 1,129,200 |
Total Working Age Population:
Total Households:
Total Working Age Population:
Total Households:
Total Working Age Population:
Total Households: