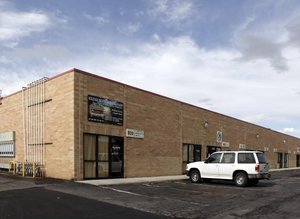
- 4,850 SF Second Level Office Available
- Site Size: 0.66 Acres
- Pylon & Crown Signage Available
- Natural Light Throughout
- ADA Accessible
- Abundant Parking
- State Street Frontage
- Easy Access to I-80 and I-15
Lease Rate Reduced: $10.00/SF Full Service
2200 South State Street, Salt Lake City, Utah 84115
For more information on this property, please contact Crystal Johnson, Derek Klopfer and Colter Smith at 801.617.1700 or by email at crystal.johnson@crcnationwide.com, derek.klopfer@crcnationwide.com, colter.smith@crcnationwide.com. Crystal, Derek and Colter are licensed real estate agents in the state of Utah and are affiliated with cRc Nationwide Real Estate Brokerage.
No part of this information may be copied, reproduced, repurposed, or screen-captured for any commercial purpose without prior written authorization from MyEListing.
While we strive to provide the most accurate information, all listing information, and demographic data, is provided by third-parties. As such, MyEListing will not be responsible for the accuracy of the information. It is strongly recommended that you verify all information with the listing agent, and any relevant agencies, prior to making any decisions.
What is the asking price for 2200 South State Street in South Salt Lake?
The asking price for 2200 South State Street is $10.00 a SF per Year
What is the building size of this commercial Office property?
The size of this lease property at '.2200 South State Street.' is 4850 square feet
What kind of Office is the propery at 2200 South State Street?
The property at 2200 South State Street South Salt Lake, UT 84115 is listed as a Professional Office property
What is the population within 1 mile of 2200 South State Street in South Salt Lake?
The population within 1 mile of 2200 South State Street South Salt Lake, UT 84115 is 14,764 people.
Who do I contact for questions about 2200 South State Street?
You should contact the listing agent,
Derek Klopfer, for any details regarding this commercial listing.