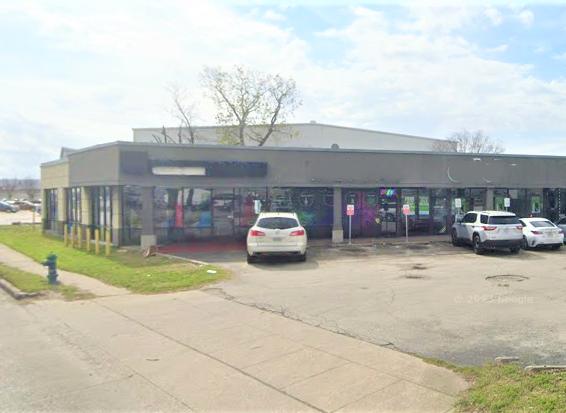
Retail Space
10008 Gulf Freeway Houston, TX 77034
10008 Gulf Freeway Houston, TX 77034
Details & Description
Property Highlights
• Easily accessible from major highways and is within walking distance of several public transportation options.
• Close proximity to Interstate 45, providing customers quick access from anywhere in the greater Houston area.
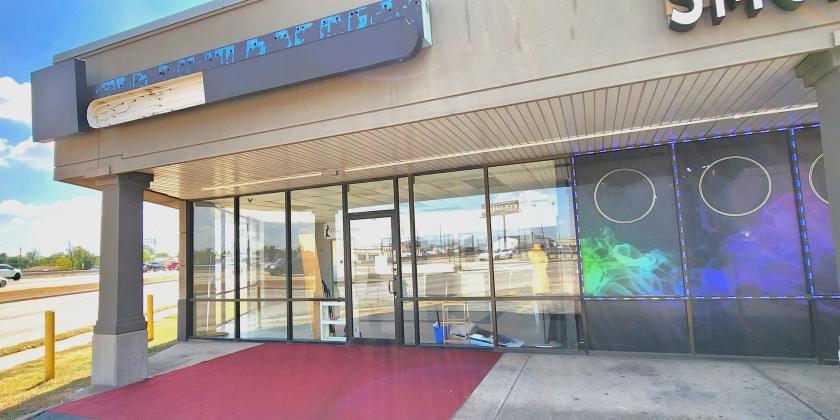
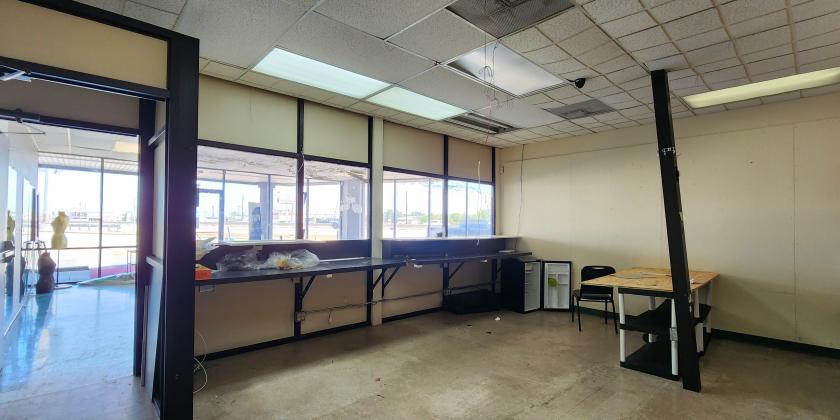
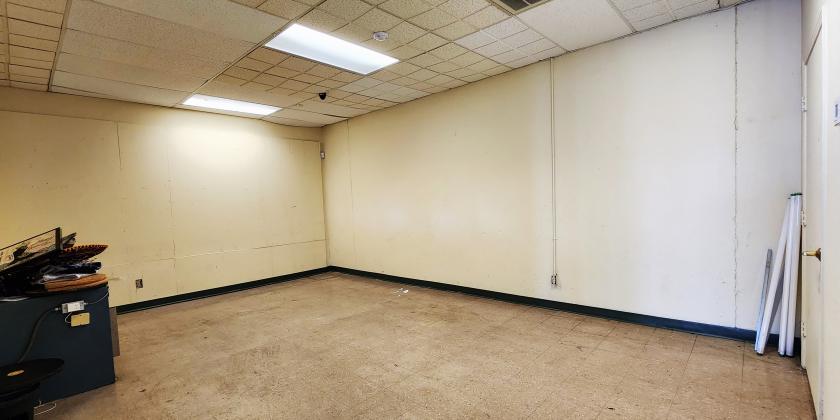
Additional Photos

Listing Agents

John Zaid
O: 281-333-3300
john@zaidlaw.com
O: 281-333-3300
john@zaidlaw.com
While we strive to provide the most accurate information, all listing information, and demographic data, is provided by third-parties. As such, MyEListing will not be responsible for the accuracy of the information. It is strongly recommended that you verify all information with the listing agent, and any relevant agencies, prior to making any decisions.


