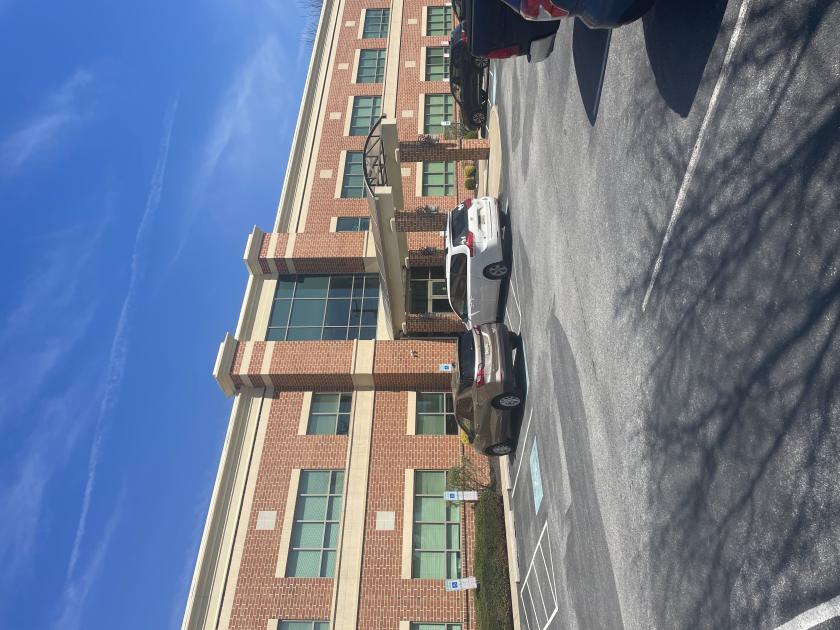
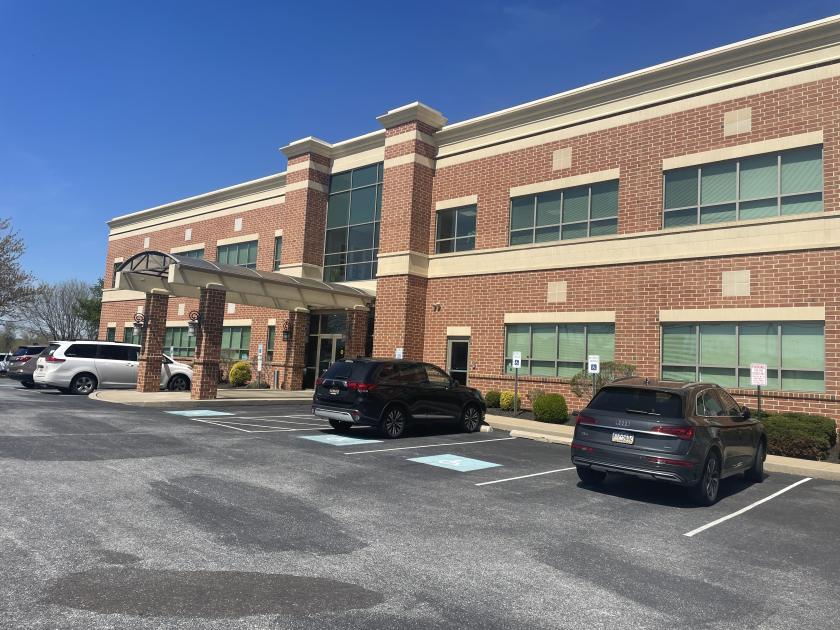
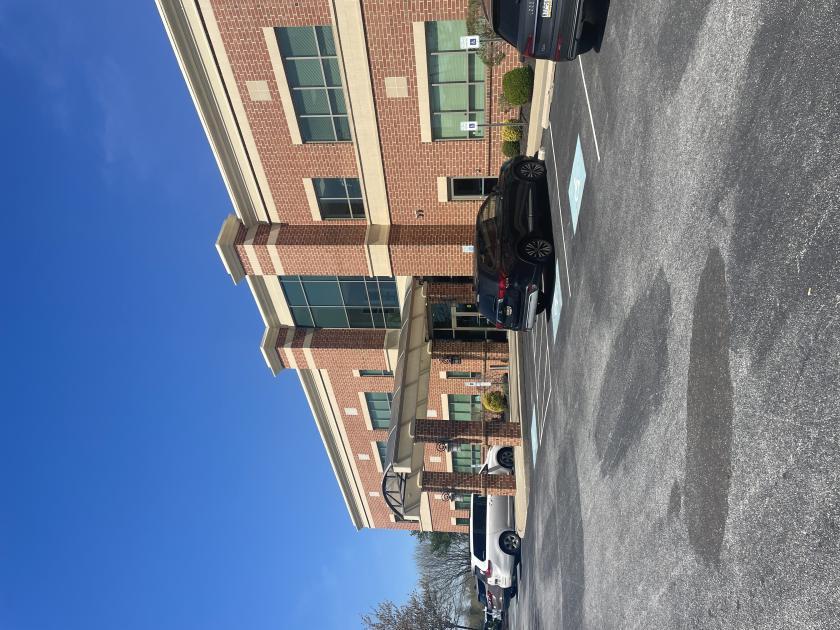
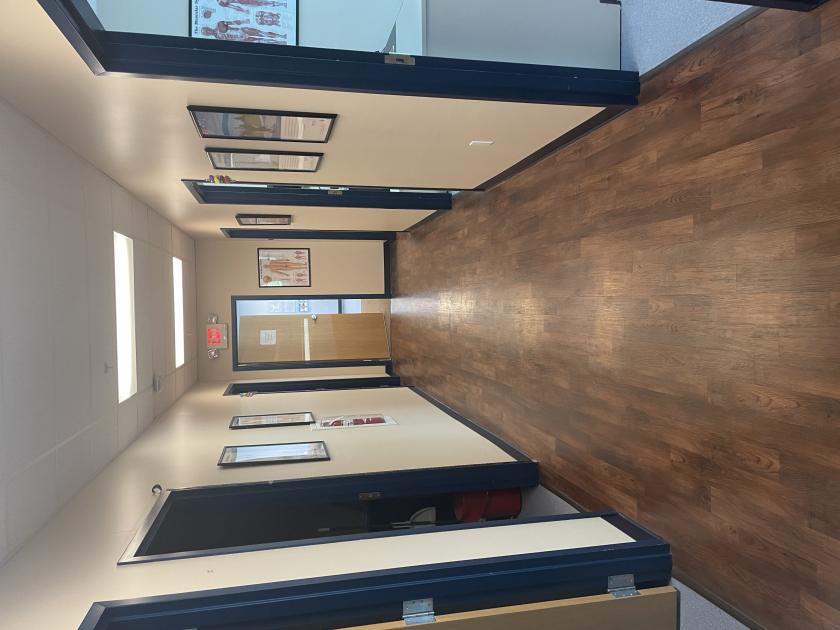
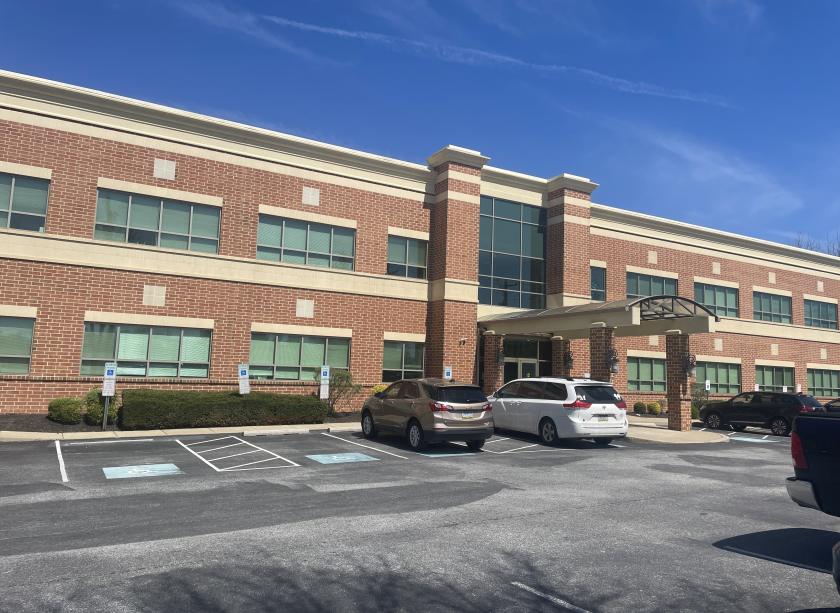
Office Space
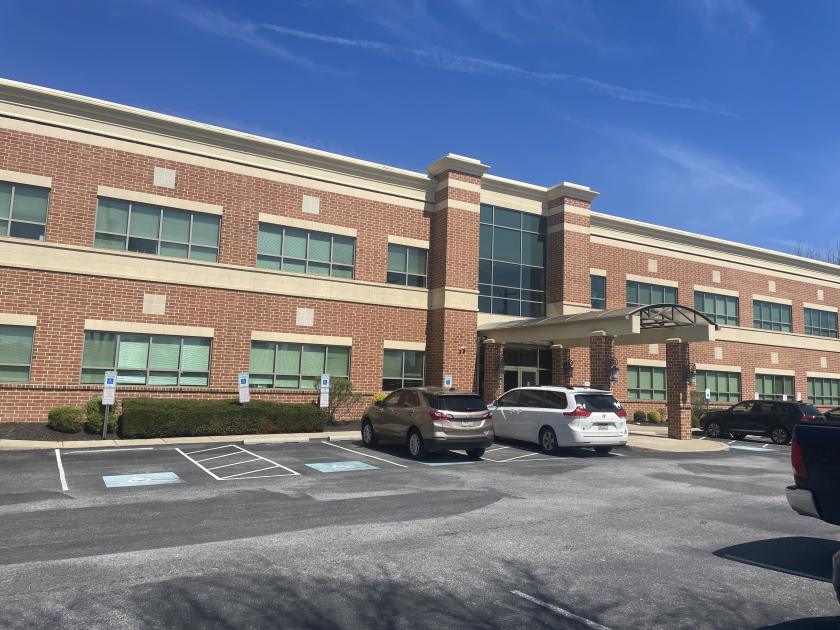
900 W Baltimore Pike West Grove, PA 19390
900 W Baltimore Pike West Grove, PA 19390
Details & Description
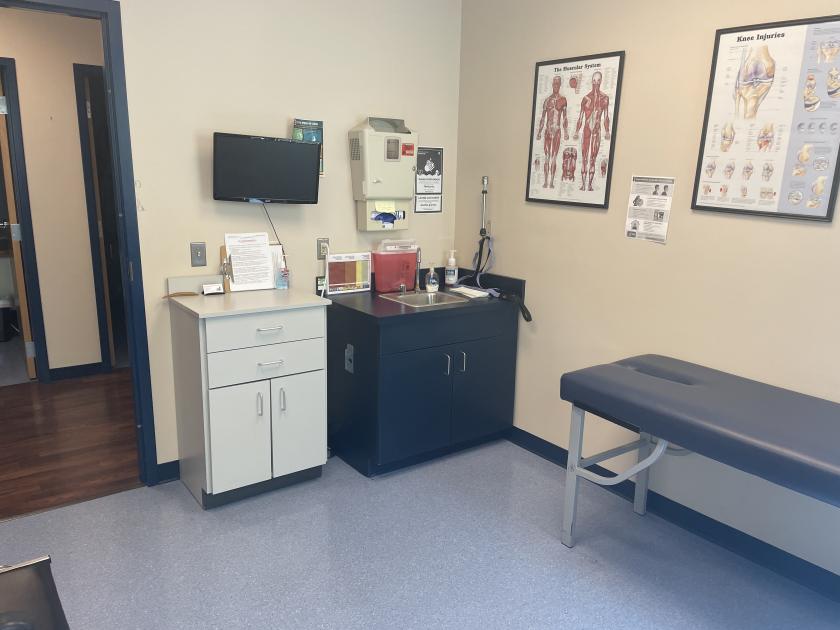
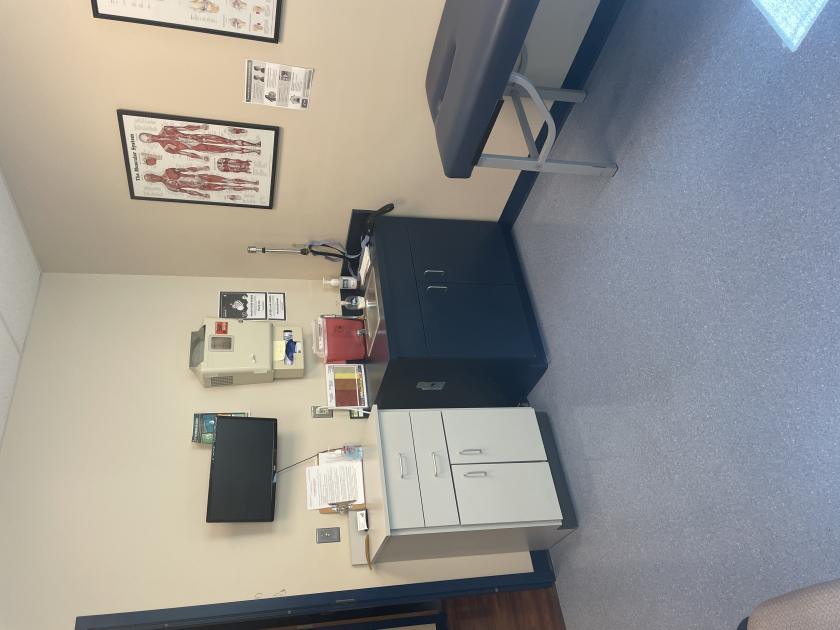
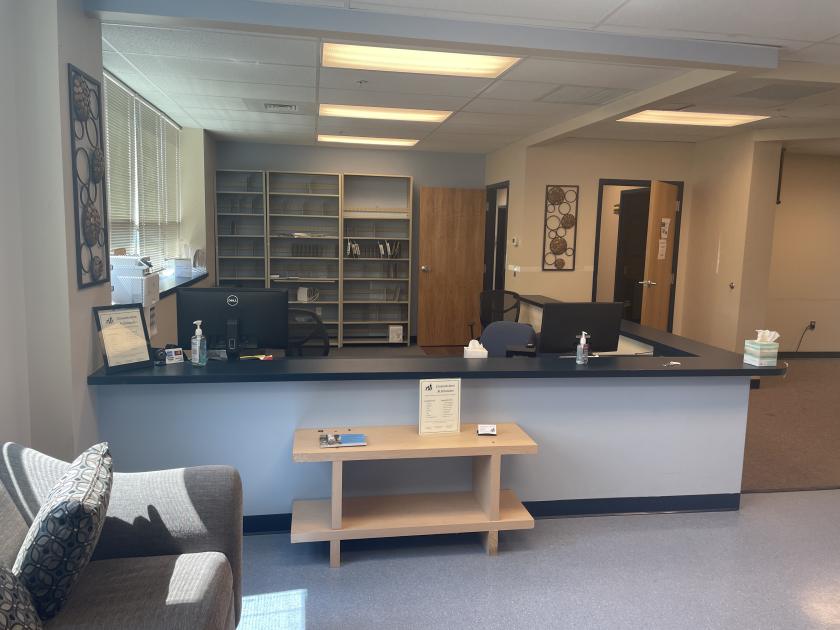
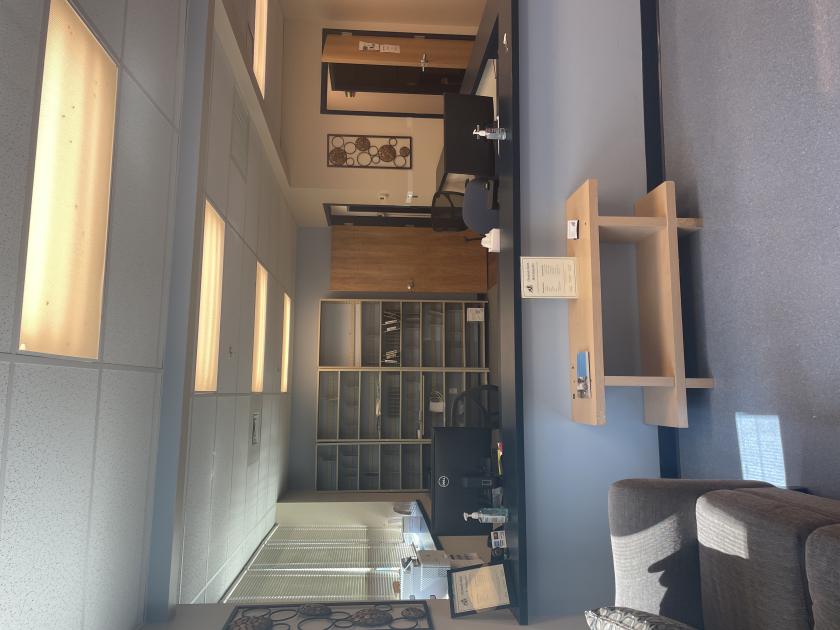
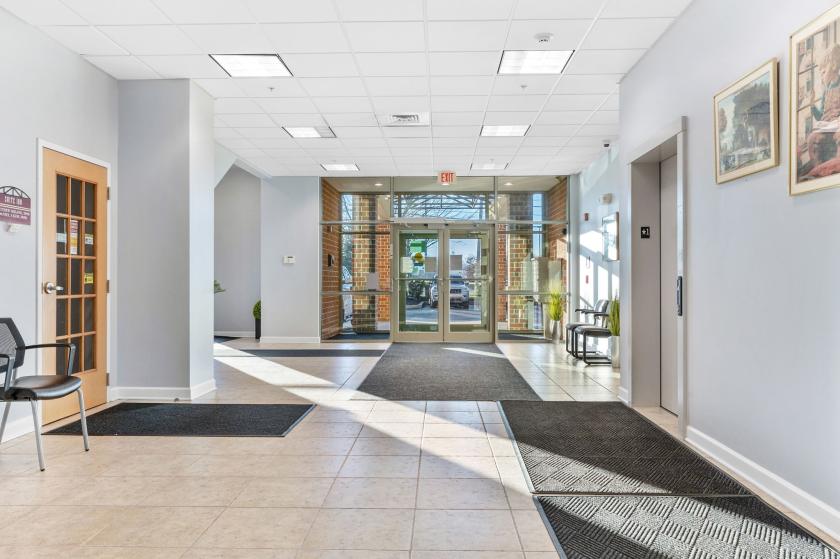
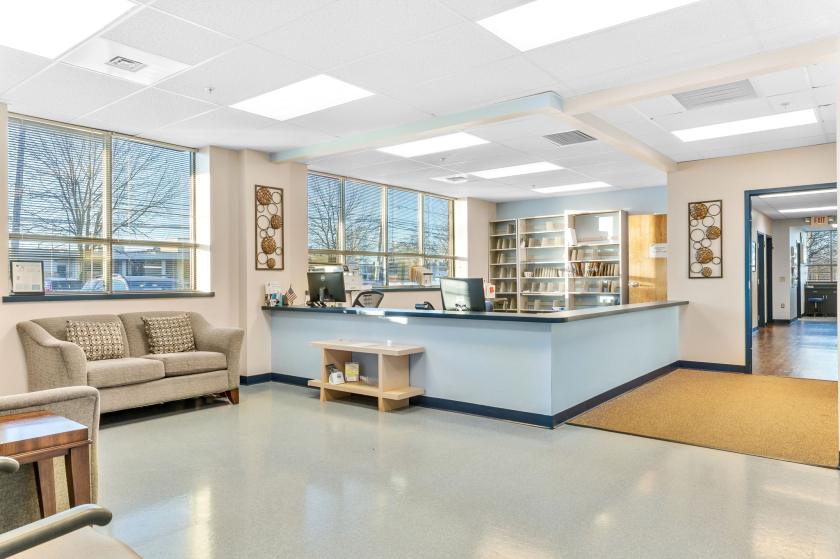
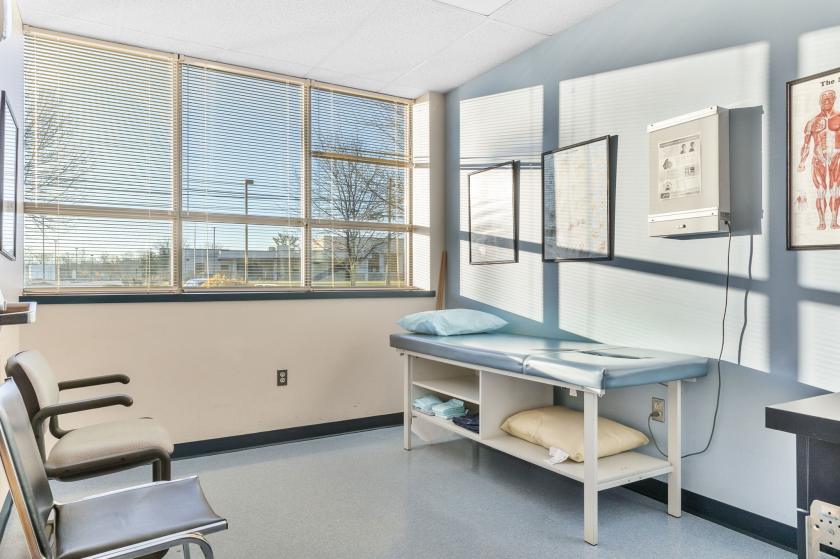
Additional Photos
Listing Agents

Andrew Carlino
O: 484-887-8202
M: 610-733-1499
acarlino@pillarrealestateadvisors.com
O: 484-887-8202
M: 610-733-1499
acarlino@pillarrealestateadvisors.com
While we strive to provide the most accurate information, all listing information, and demographic data, is provided by third-parties. As such, MyEListing will not be responsible for the accuracy of the information. It is strongly recommended that you verify all information with the listing agent, and any relevant agencies, prior to making any decisions.