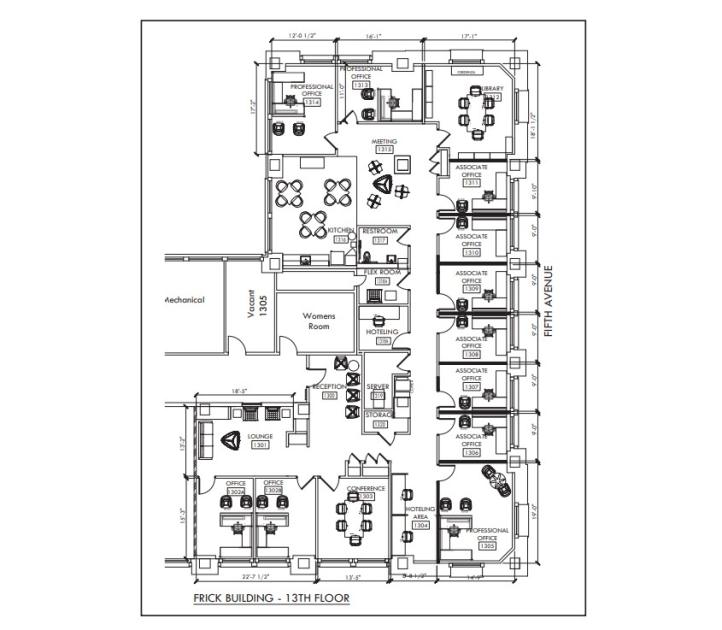
Office Space
437 Grant Street Pittsburgh, PA 15219
437 Grant Street Pittsburgh, PA 15219
Details & Description
Property Highlights
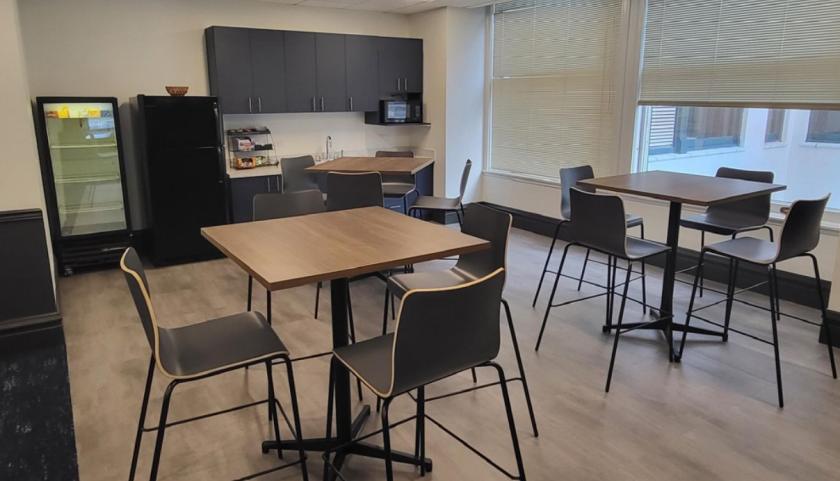
- • Tenant fitness facility
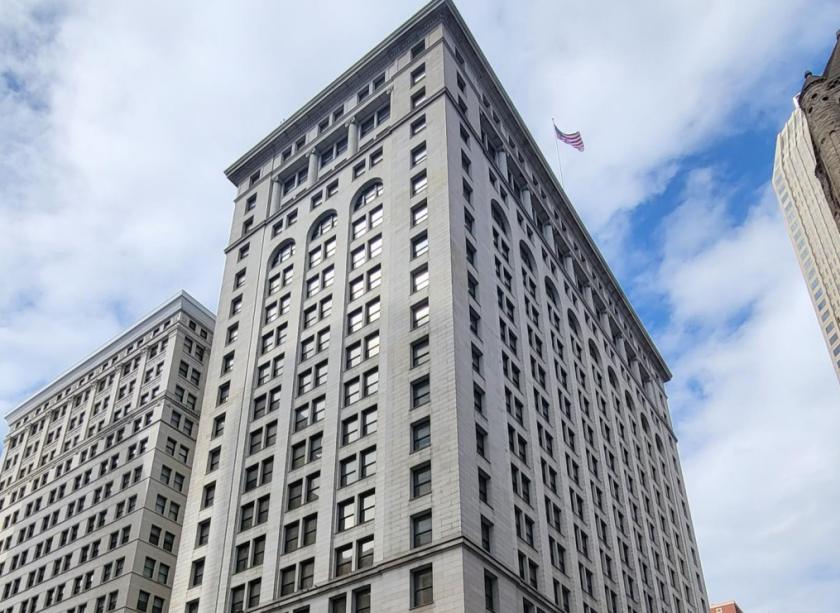
- • 24-hour attended lobby with security cameras
- • Upgraded elevator and mechanical systems
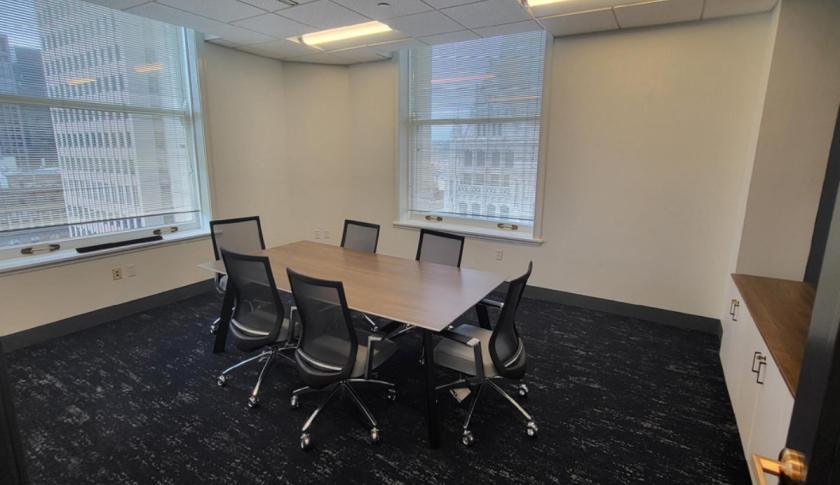
- • High ceilings with oversized windows
- • State-of-the-art Tenant Innovation Center
Additional Photos


Listing Agents

Edie Hartman
O: 412-697-1670
M: 412-983-5779
edie.hartman@cushwake.com
O: 412-697-1670
M: 412-983-5779
edie.hartman@cushwake.com
While we strive to provide the most accurate information, all listing information, and demographic data, is provided by third-parties. As such, MyEListing will not be responsible for the accuracy of the information. It is strongly recommended that you verify all information with the listing agent, and any relevant agencies, prior to making any decisions.