Office Space
4 Penn Center Blvd Pittsburgh, PA 15205
4 Penn Center Blvd Pittsburgh, PA 15205
Details & Description
Property Highlights
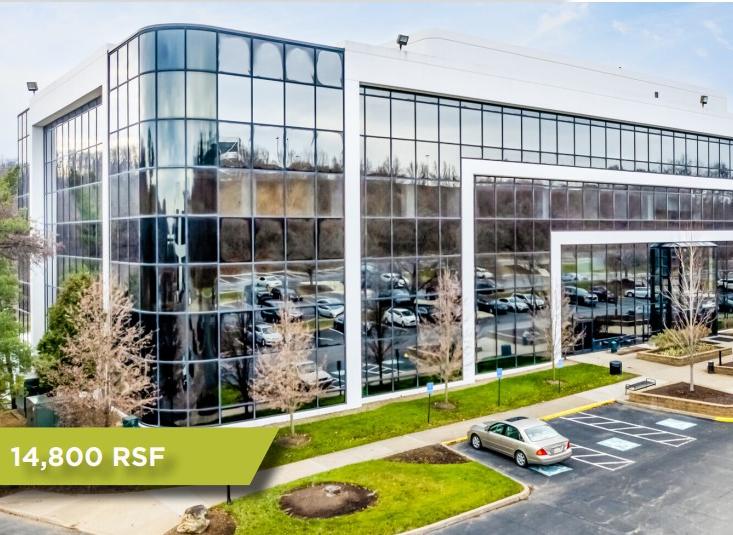
- • Ample free parking and easy access to Parkway West
- • 10 minutes to Pittsburgh International Airport
- • 10 minutes to downtown,
- • 2 minutes to Settler’s Ridge
- • 3 miles to Robinson Town Centre
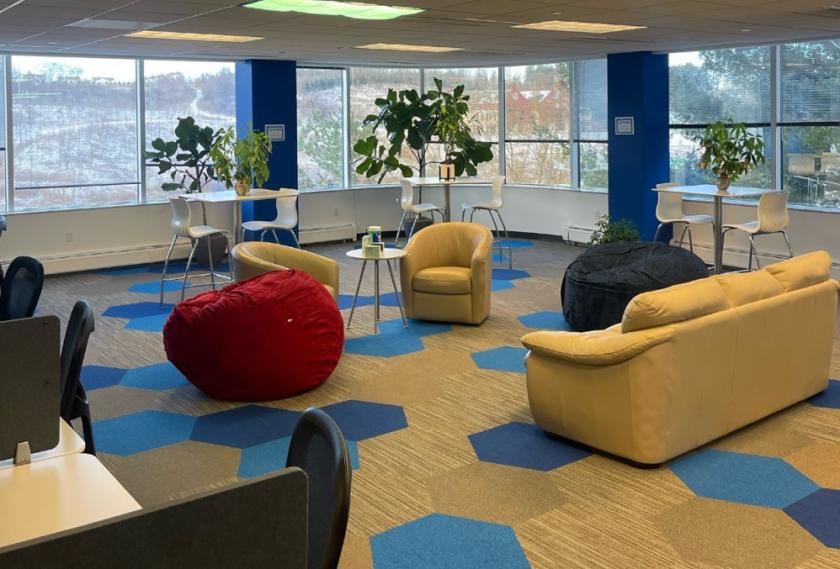
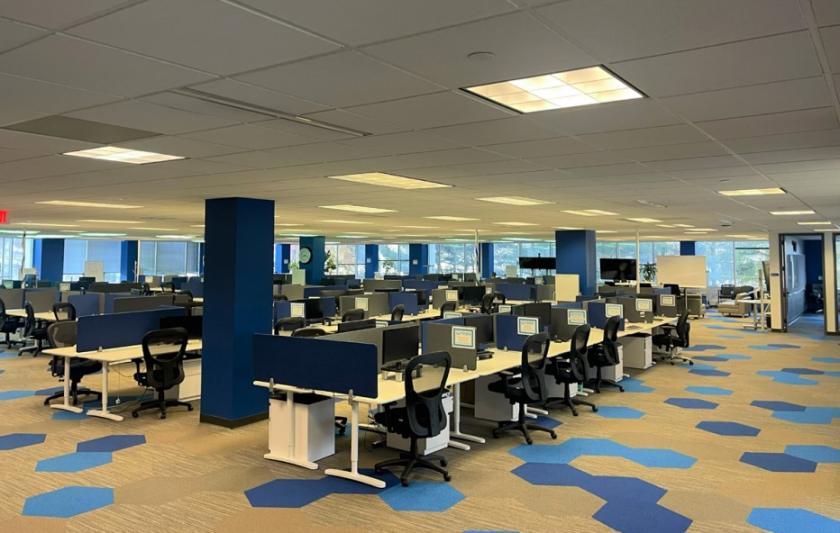
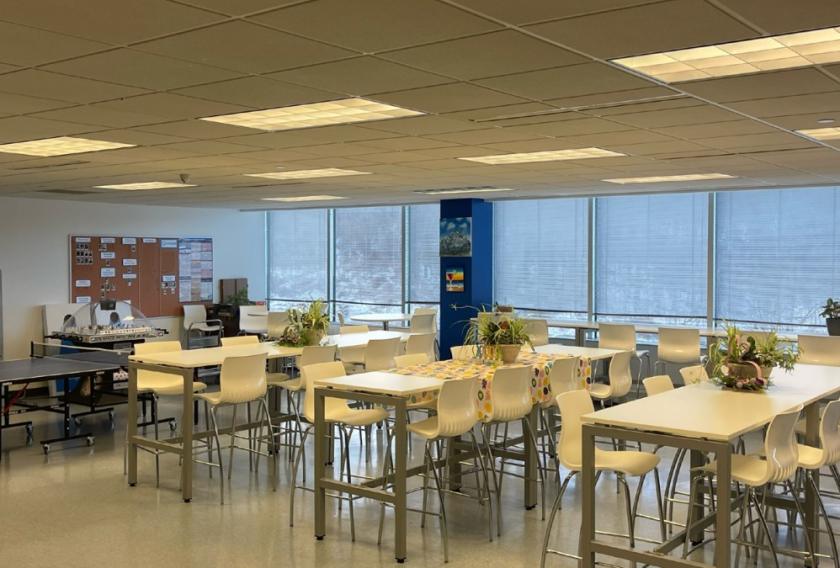
- • Outdoor public spaces and natural light
Additional Photos


Listing Agents

Edie Hartman
O: 412-697-1670
M: 412-983-5779
edie.hartman@cushwake.com
O: 412-697-1670
M: 412-983-5779
edie.hartman@cushwake.com
While we strive to provide the most accurate information, all listing information, and demographic data, is provided by third-parties. As such, MyEListing will not be responsible for the accuracy of the information. It is strongly recommended that you verify all information with the listing agent, and any relevant agencies, prior to making any decisions.