Office Space
5 Penn Center Blvd Pittsburgh, PA 15205
5 Penn Center Blvd Pittsburgh, PA 15205
Details & Description
Property Highlights
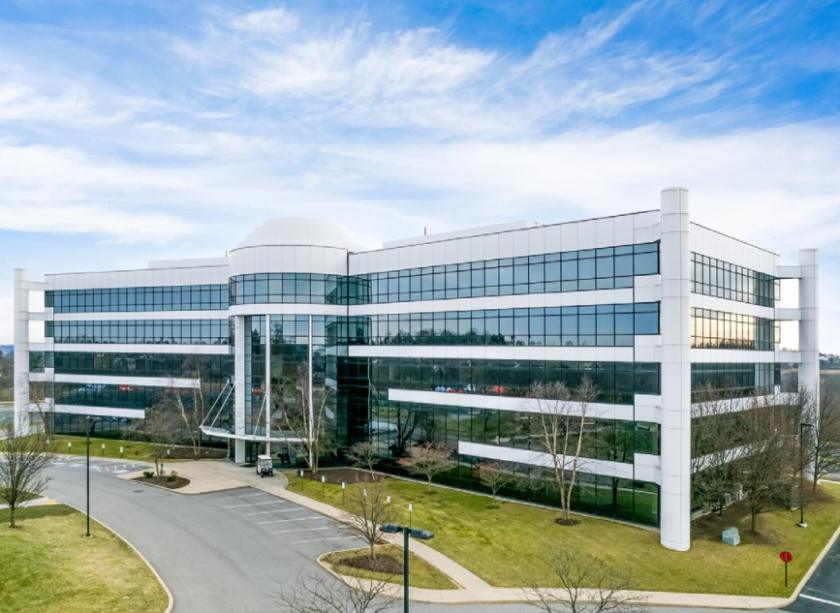
- • Trophy class five-story office building
- • High visibility and easy access to I-376 W
- • 10 minutes to Pittsburgh International Airport
- • On-site management
- • Abundant free parking
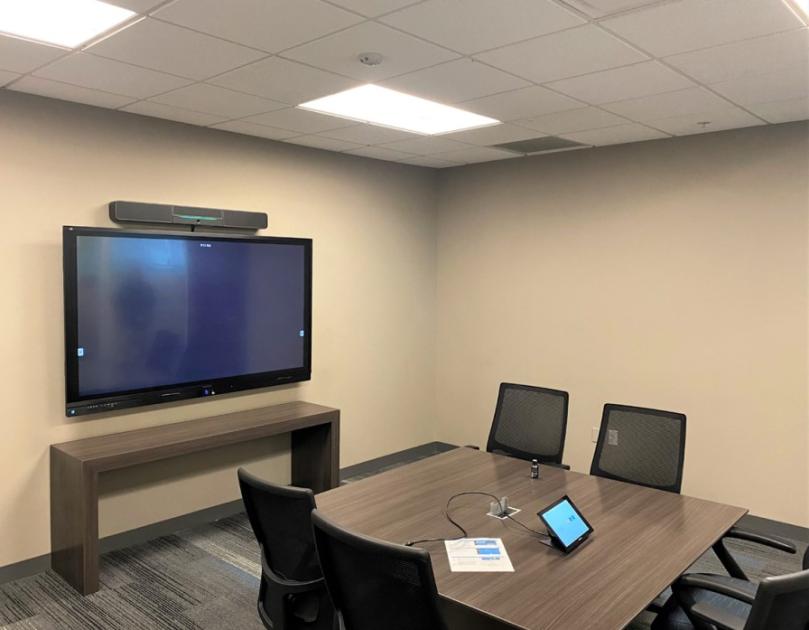
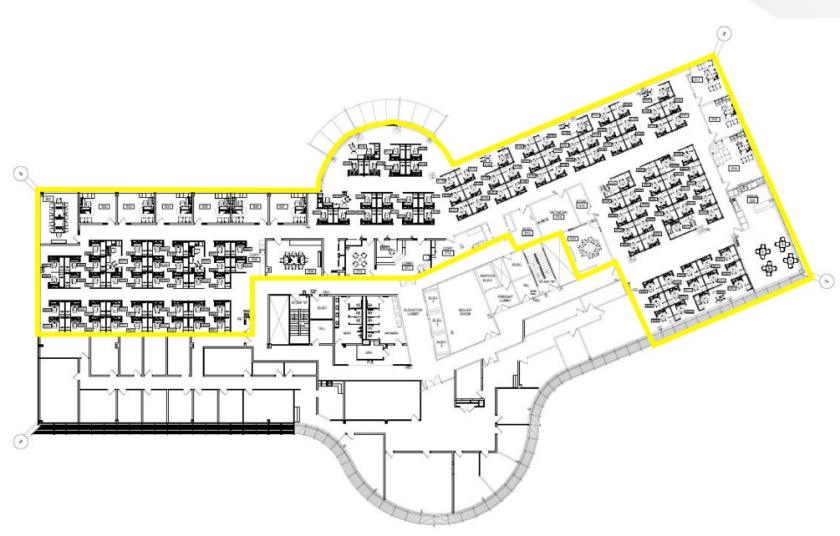
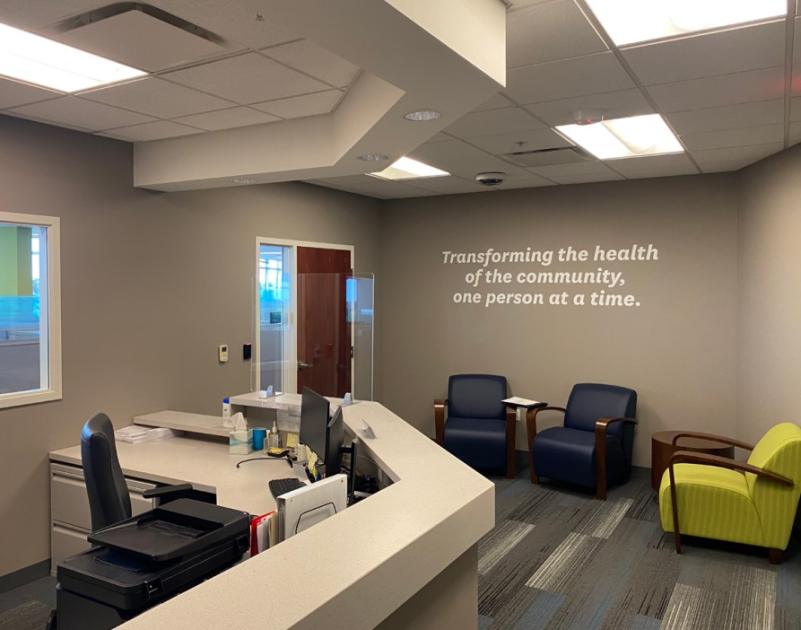
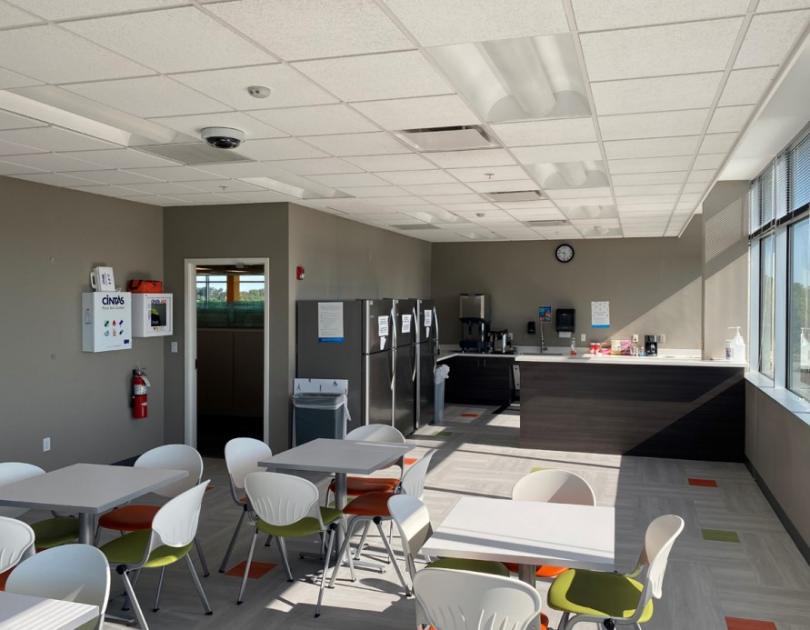
Additional Photos

Listing Agents

Timothy Goetz
O: 412-391-2632
M: 412-337-3305
tim.r.goetz@cushwake.com
O: 412-391-2632
M: 412-337-3305
tim.r.goetz@cushwake.com
While we strive to provide the most accurate information, all listing information, and demographic data, is provided by third-parties. As such, MyEListing will not be responsible for the accuracy of the information. It is strongly recommended that you verify all information with the listing agent, and any relevant agencies, prior to making any decisions.