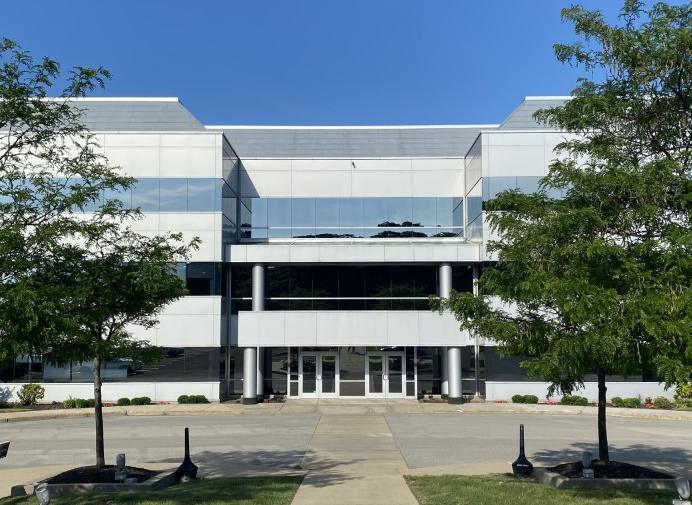
Office Space
300-310 Seven Fields Blvd Seven Fields, PA 16046
300-310 Seven Fields Blvd Seven Fields, PA 16046
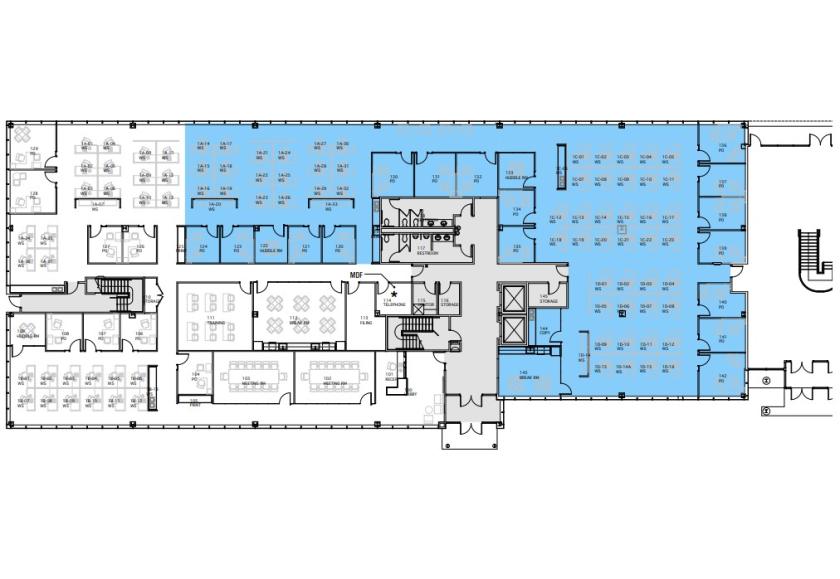
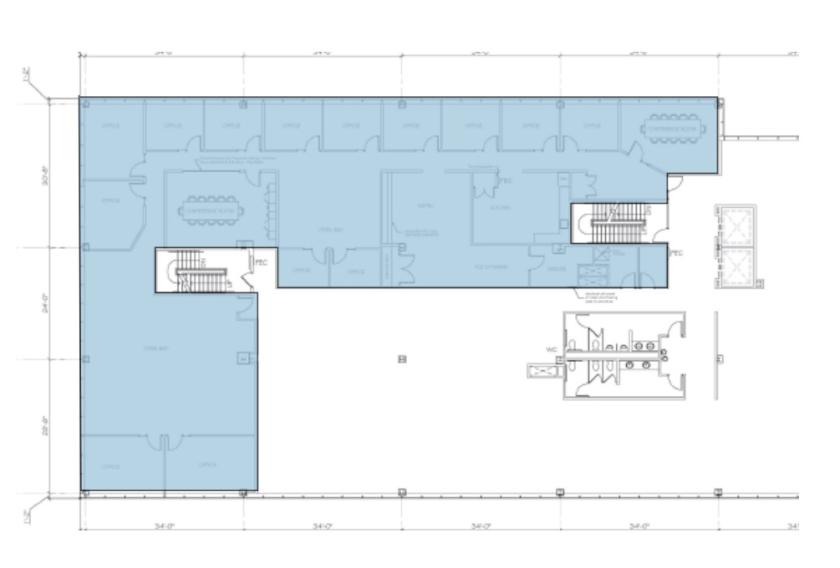
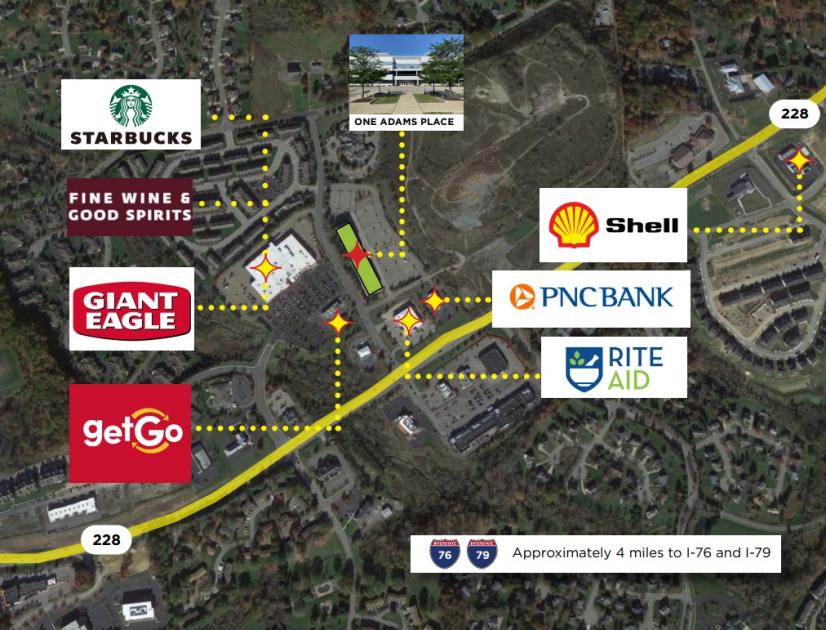
Details & Description
Property Highlights
- • 4.2/1,000 SF parking ratio
- • On-site management
- • Efficient floor plan with abundant natural light
- • Class A office space - high quality finish
Additional Photos
Listing Agents

Timothy Goetz
O: 412-391-2632
M: 412-337-3305
tim.r.goetz@cushwake.com
O: 412-391-2632
M: 412-337-3305
tim.r.goetz@cushwake.com
While we strive to provide the most accurate information, all listing information, and demographic data, is provided by third-parties. As such, MyEListing will not be responsible for the accuracy of the information. It is strongly recommended that you verify all information with the listing agent, and any relevant agencies, prior to making any decisions.


