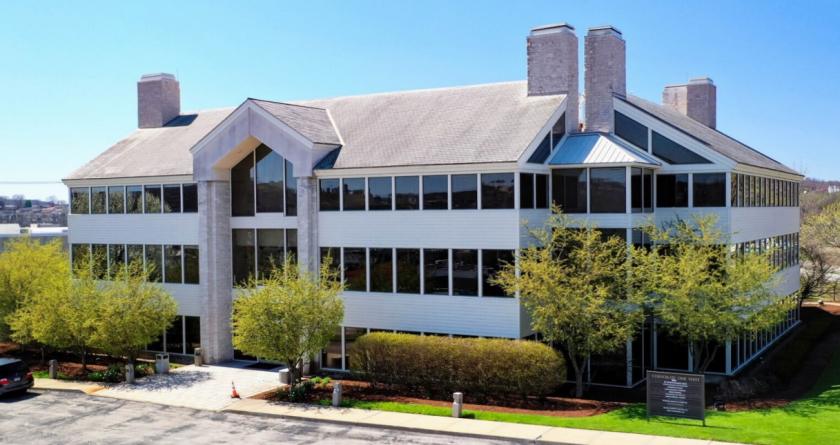
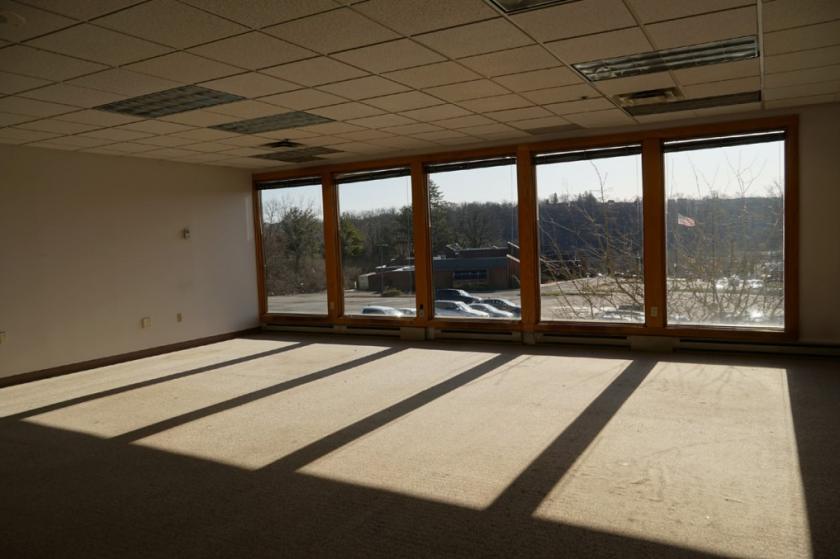
Office Space
1195 Washington Pike Bridgeville, PA 15017
1195 Washington Pike Bridgeville, PA 15017
Details & Description
Property Highlights
- • Situated on 3.59 acres
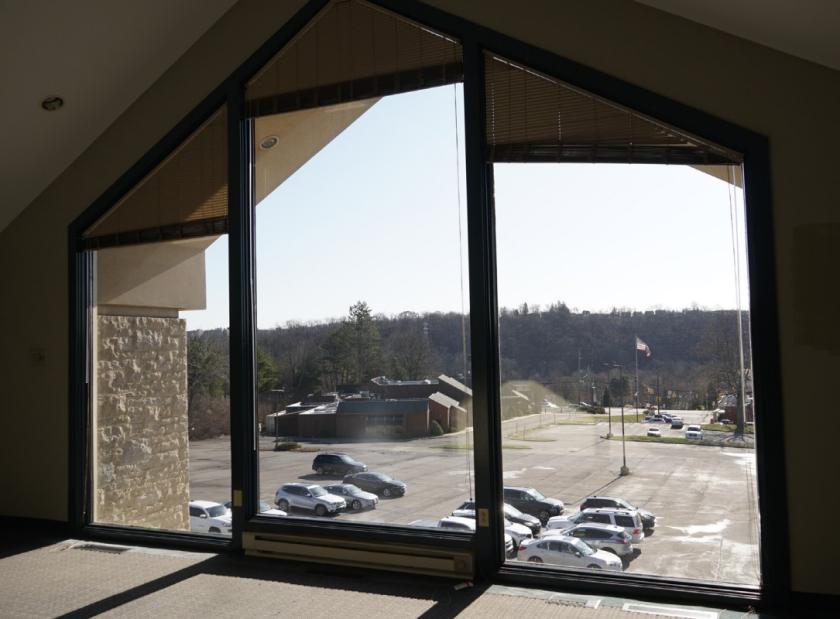
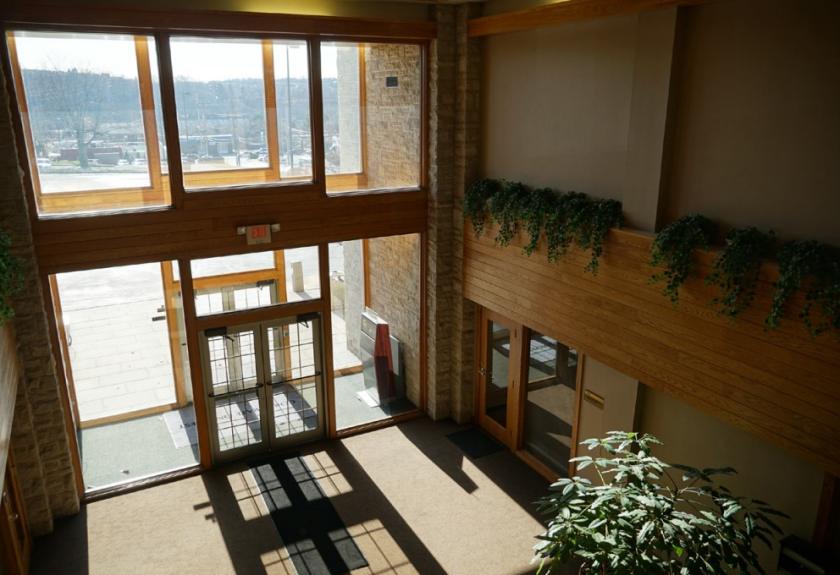
- • Great natural light
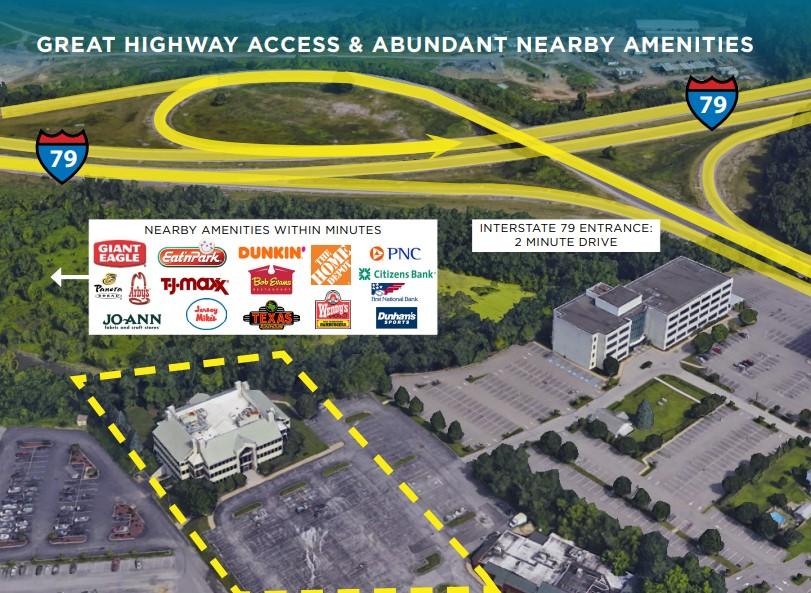
- • 2 minutes to the I-79 Interchange
- • Abundant nearby retail amenities
- • 180 parking spaces
- • Full floor opportunity
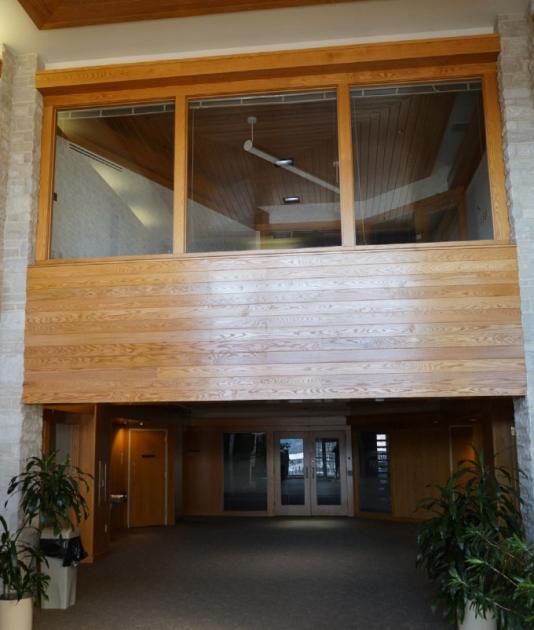
Additional Photos
Listing Agents

Darin Shriver
O: 412-391-2602
M: 724-255-9540
darin.shriver@cushwake.com
O: 412-391-2602
M: 724-255-9540
darin.shriver@cushwake.com
Jack ODonoghue
O: 412-391-2621
M: 412-337-0105
jack.odonoghue@cushwake.com
O: 412-391-2621
M: 412-337-0105
jack.odonoghue@cushwake.com
While we strive to provide the most accurate information, all listing information, and demographic data, is provided by third-parties. As such, MyEListing will not be responsible for the accuracy of the information. It is strongly recommended that you verify all information with the listing agent, and any relevant agencies, prior to making any decisions.