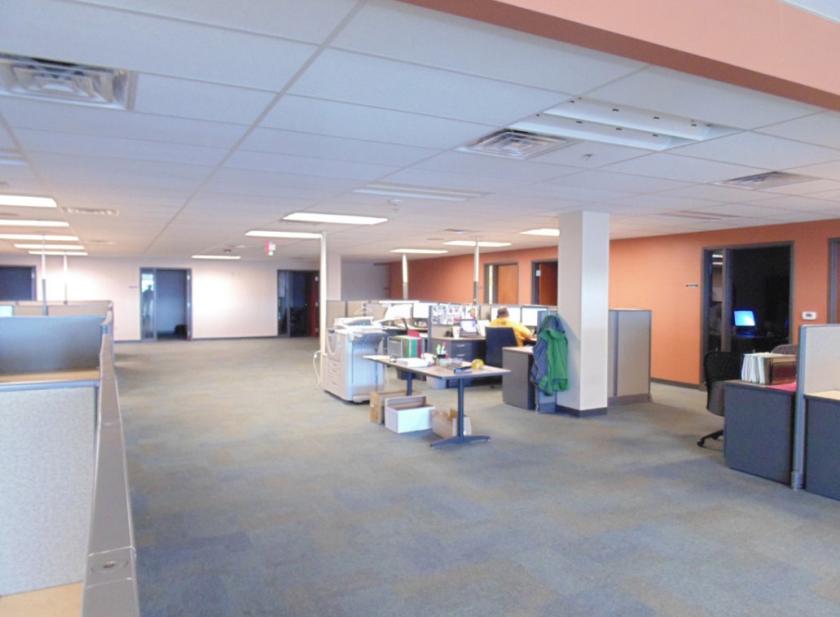
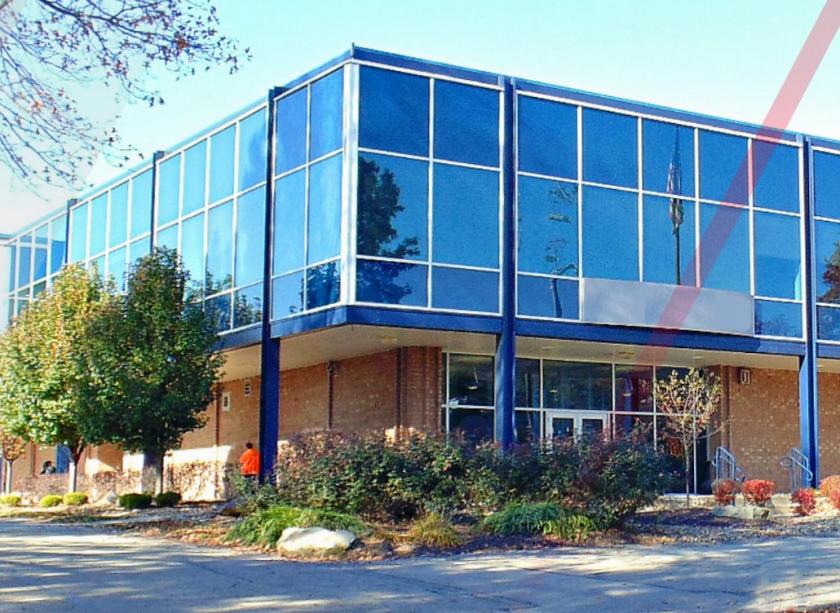
Office Space
615 Alpha Drive Pittsburgh, PA 15238
615 Alpha Drive Pittsburgh, PA 15238
Details & Description
Property Highlights
- • Abundant natural light
- • New roof and mechanical systems since 2009
- • 4/1,000 SF parking ratio
- • Fully sprinklered
- • Awarded past NAIOP Best Renovation Project
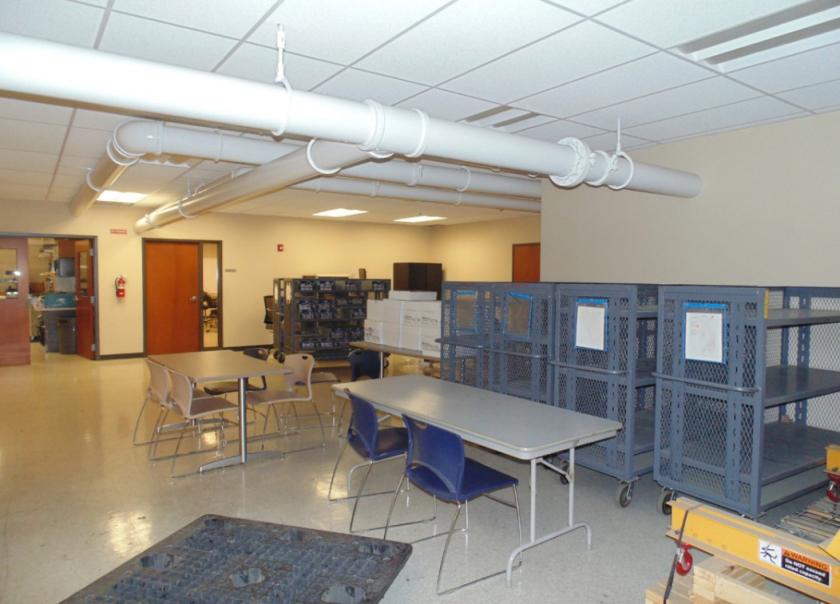
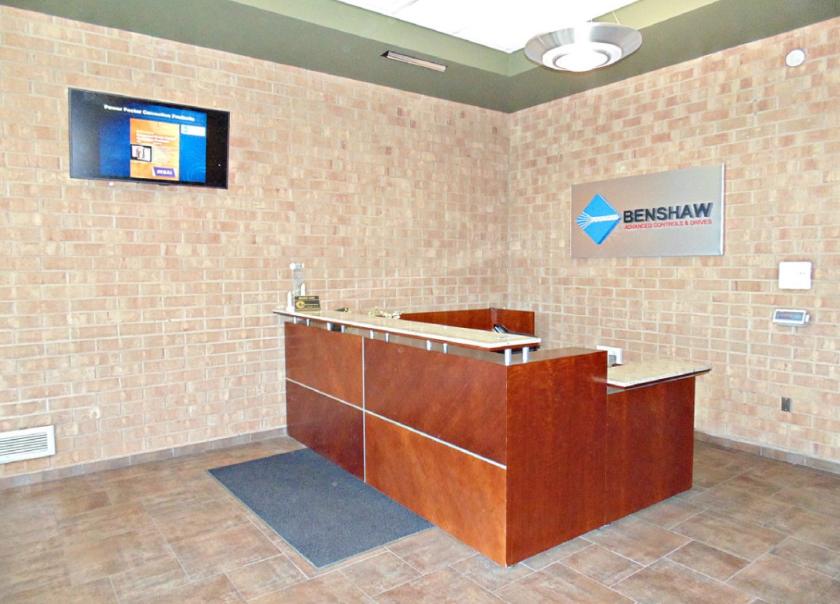
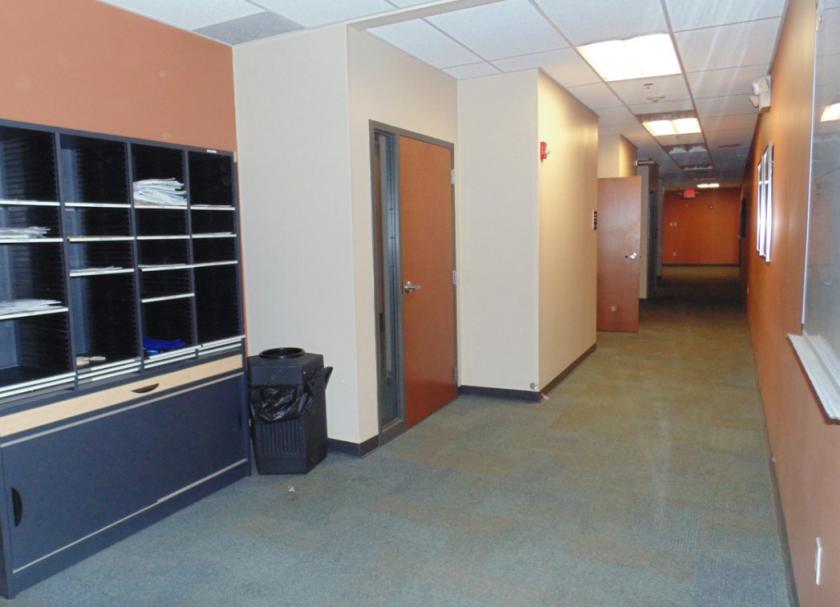
Additional Photos


Listing Agents

Evan Cicirello
O: 412-697-6558
M: 412-491-3030
evan.cicirello@cushwake.com
O: 412-697-6558
M: 412-491-3030
evan.cicirello@cushwake.com
While we strive to provide the most accurate information, all listing information, and demographic data, is provided by third-parties. As such, MyEListing will not be responsible for the accuracy of the information. It is strongly recommended that you verify all information with the listing agent, and any relevant agencies, prior to making any decisions.