Office Space
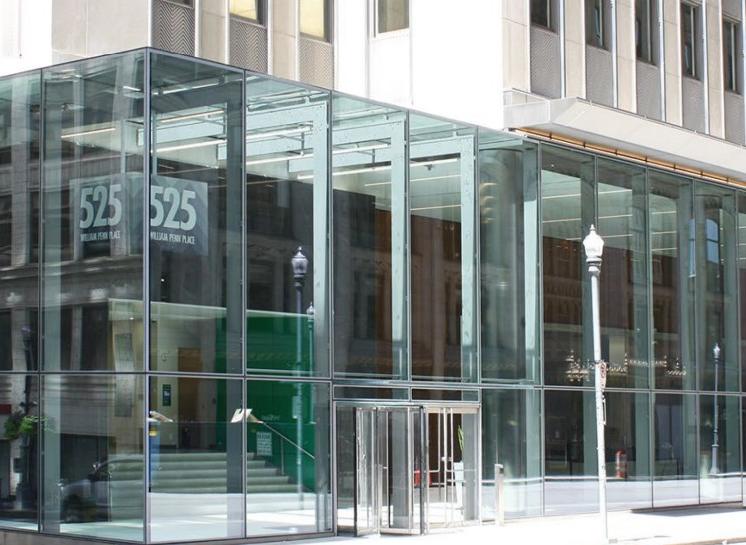
525 William Penn Place Pittsburgh, PA 15219
525 William Penn Place Pittsburgh, PA 15219
Details & Description
Property Highlights
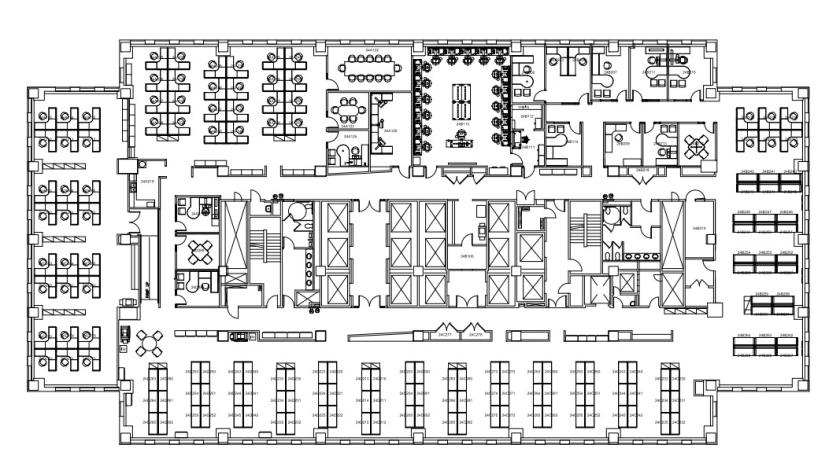
- • Entire floor for sublease
- • Newly redone building lobby and entrance
- • High-rise location with great views of the city
- • Term runs through 11/30/2024
- • Available immediately with furniture
- • Abundant natural light & prestigious location
Listing Agents

Timothy Goetz
O: 412-391-2632
M: 412-337-3305
tim.r.goetz@cushwake.com
O: 412-391-2632
M: 412-337-3305
tim.r.goetz@cushwake.com
While we strive to provide the most accurate information, all listing information, and demographic data, is provided by third-parties. As such, MyEListing will not be responsible for the accuracy of the information. It is strongly recommended that you verify all information with the listing agent, and any relevant agencies, prior to making any decisions.