Office Space
200 Fleet Street Pittsburgh, PA 15220
200 Fleet Street Pittsburgh, PA 15220

Details & Description
Property Highlights
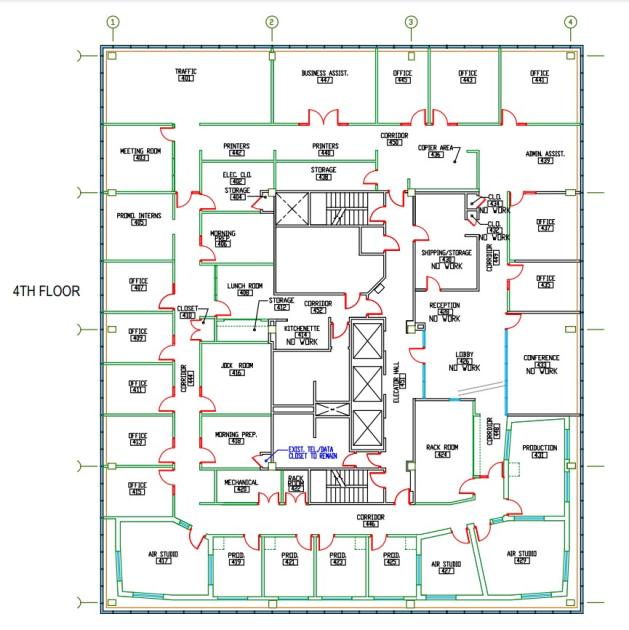
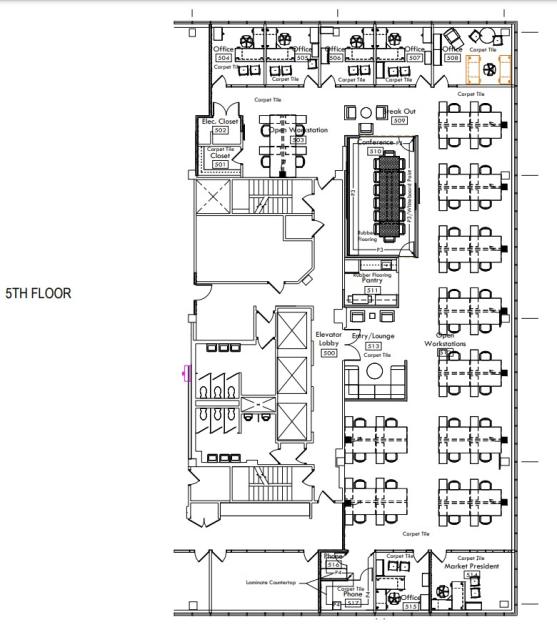
- • Office/radio studio space
- • High visibility location
- • Easy access on and off I-376
- • Minutes to Downtown Pittsburgh
- • Available immediately
- • Sublease through 8/31/25
Additional Photos


Listing Agents

Timothy Goetz
O: 412-391-2632
M: 412-337-3305
tim.r.goetz@cushwake.com
O: 412-391-2632
M: 412-337-3305
tim.r.goetz@cushwake.com
While we strive to provide the most accurate information, all listing information, and demographic data, is provided by third-parties. As such, MyEListing will not be responsible for the accuracy of the information. It is strongly recommended that you verify all information with the listing agent, and any relevant agencies, prior to making any decisions.