Commercial Land
380 Idaho Maryland Road Grass Valley, CA 95945
380 Idaho Maryland Road Grass Valley, CA 95945
Details & Description
Property Highlights
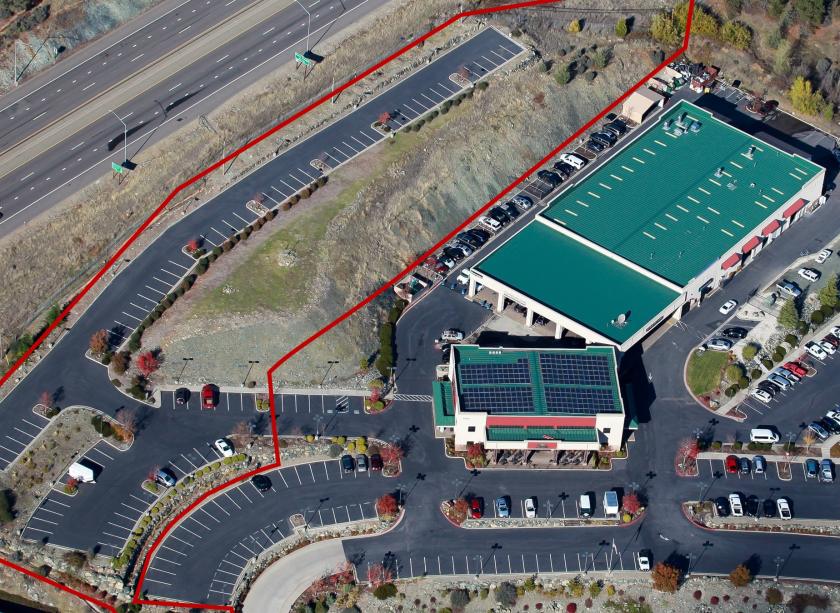
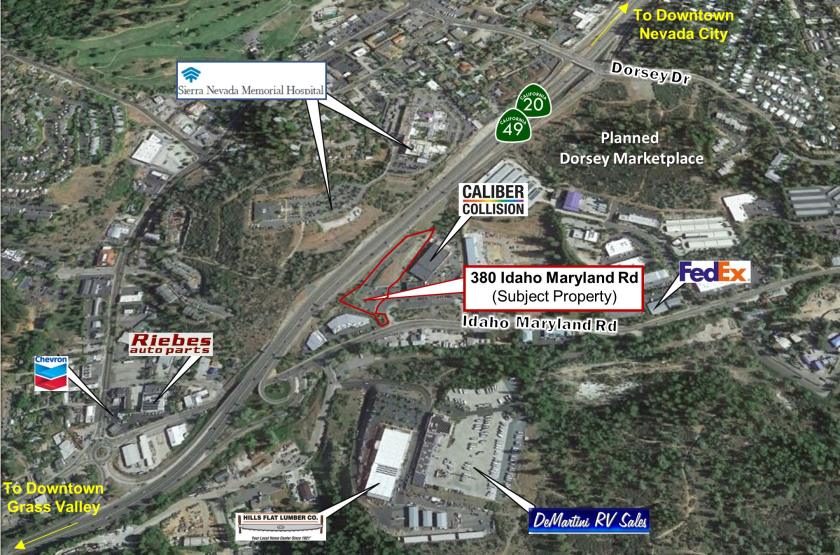
- • 2.57 acres adjacent to Highway 49/20.
- • Coveted M-1 / Light Industrial zoning.
- • Just under 800' of freeway frontage.
- • Currently fenced and asphalt surfaced.
Additional Photos


Listing Agents

Lock Richards
O: 530-470-1740
lock@highlandcre.com
O: 530-470-1740
lock@highlandcre.com
While we strive to provide the most accurate information, all listing information, and demographic data, is provided by third-parties. As such, MyEListing will not be responsible for the accuracy of the information. It is strongly recommended that you verify all information with the listing agent, and any relevant agencies, prior to making any decisions.


