Office Space
100 Global View Drive Warrendale, PA 15086
100 Global View Drive Warrendale, PA 15086

Details & Description
Property Highlights
- • Easy access to I-79 and PA Turnpike
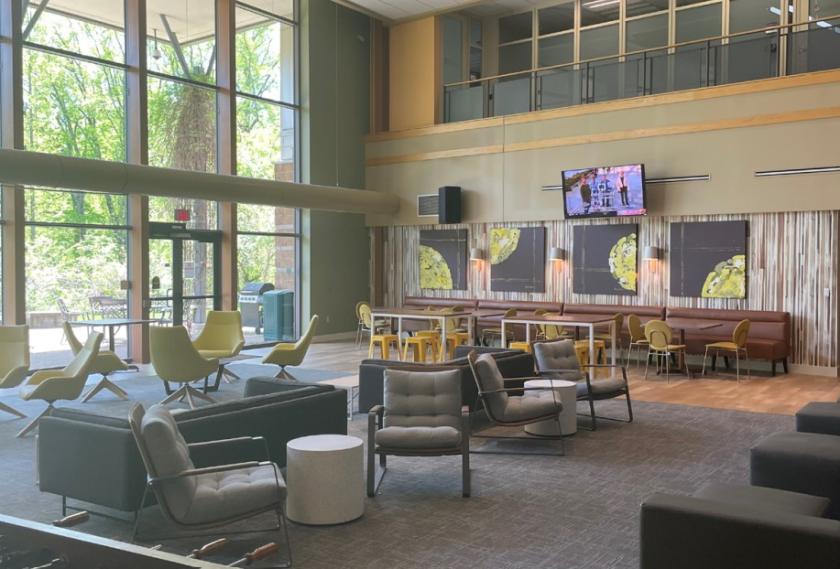
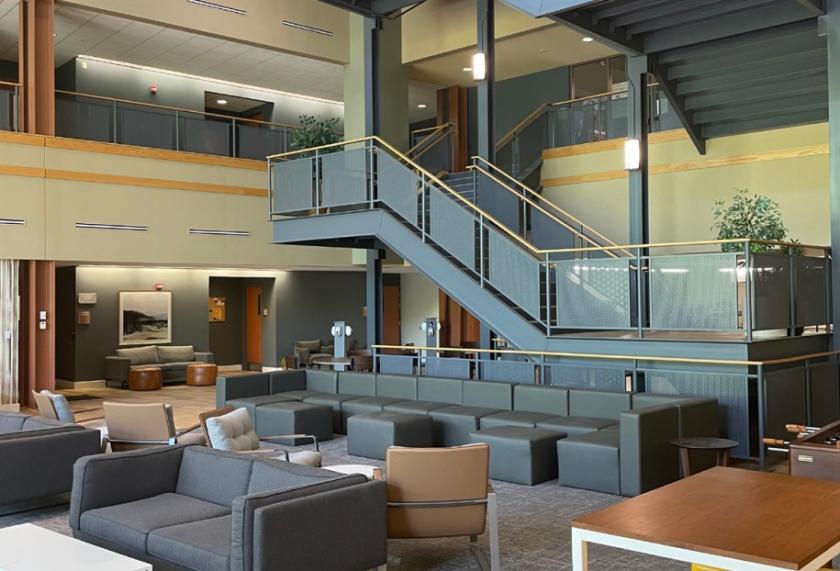
- • Corporate campus setting
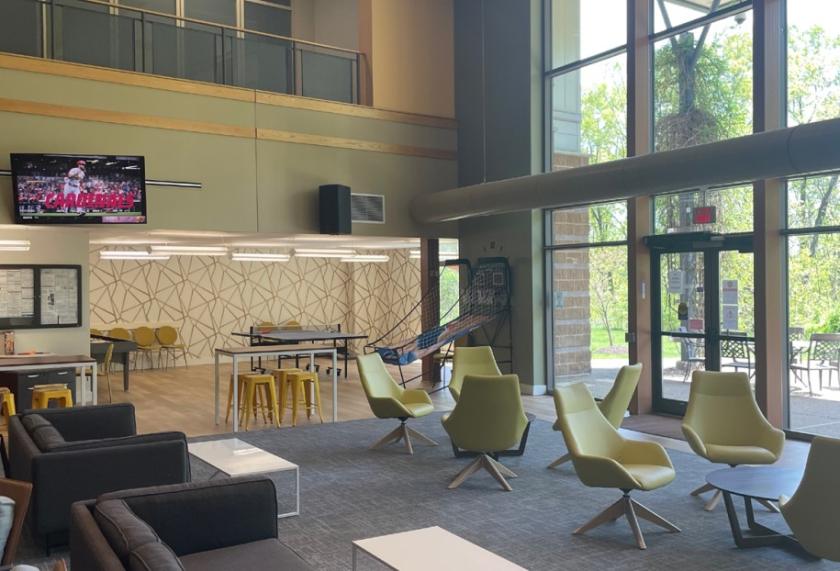
- • On-site cafeteria and fitness center
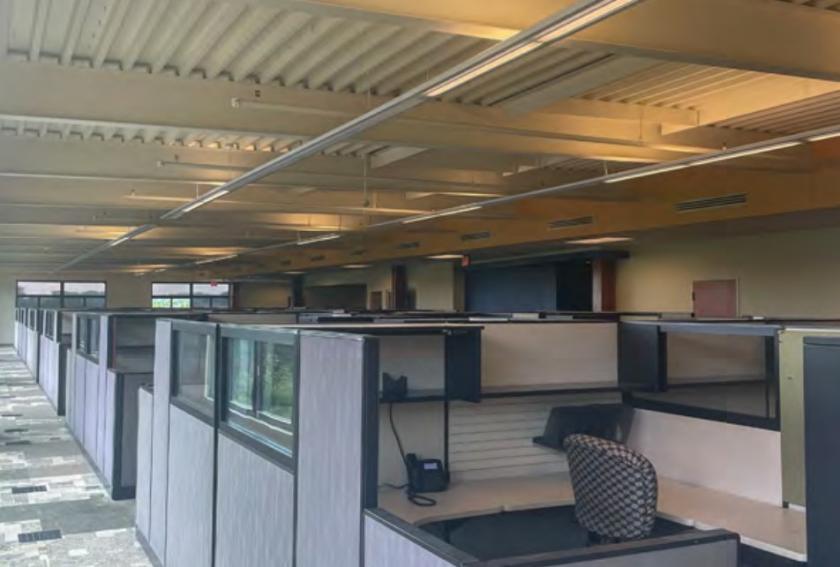
Additional Photos

Listing Agents

Sam McGill
O: 412-391-2635
M: 412-606-1618
sam.mcgill@cushwake.com
O: 412-391-2635
M: 412-606-1618
sam.mcgill@cushwake.com
Randall McCombs
O: 412-391-0990
M: 412-779-4222
randall.mccombs@cushwake.com
O: 412-391-0990
M: 412-779-4222
randall.mccombs@cushwake.com
While we strive to provide the most accurate information, all listing information, and demographic data, is provided by third-parties. As such, MyEListing will not be responsible for the accuracy of the information. It is strongly recommended that you verify all information with the listing agent, and any relevant agencies, prior to making any decisions.