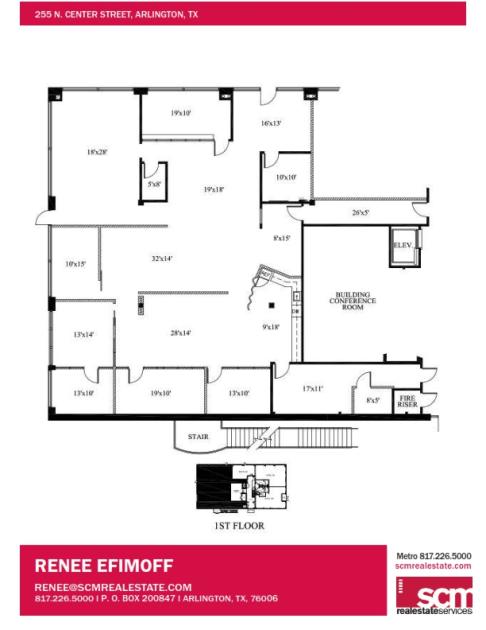
Office Space
255 North Center Street Arlington, TX 76011
255 North Center Street Arlington, TX 76011

Details & Description
Property Highlights
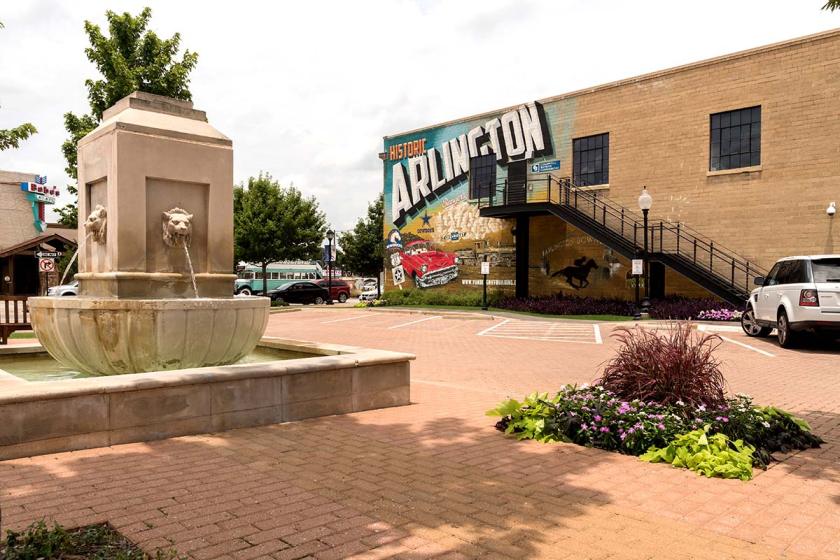
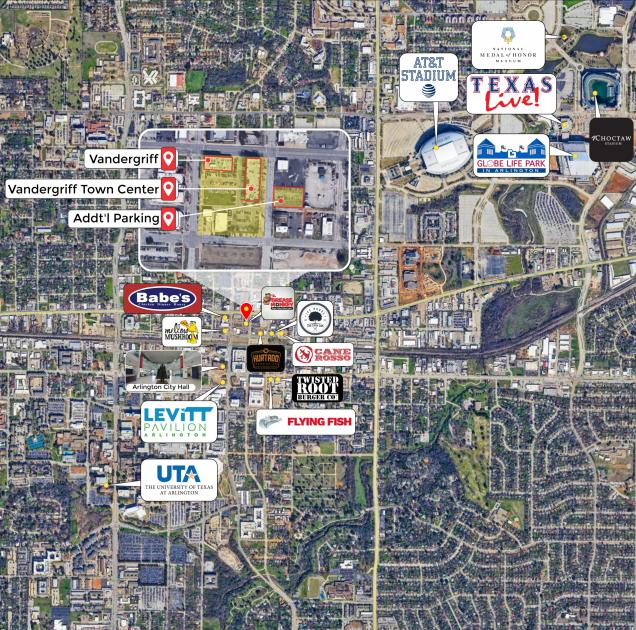
• Walking distance to Arlington City Hall, Municipal Offices, and George Hawkes Downtown Library
• Surrounded by restaurants, retail and entertainment venues.
Additional Photos
Listing Agents

Renee Efimoff
O: 817-226-5000
M: 817-435-8345
renee@scmrealestate.com
O: 817-226-5000
M: 817-435-8345
renee@scmrealestate.com
While we strive to provide the most accurate information, all listing information, and demographic data, is provided by third-parties. As such, MyEListing will not be responsible for the accuracy of the information. It is strongly recommended that you verify all information with the listing agent, and any relevant agencies, prior to making any decisions.


