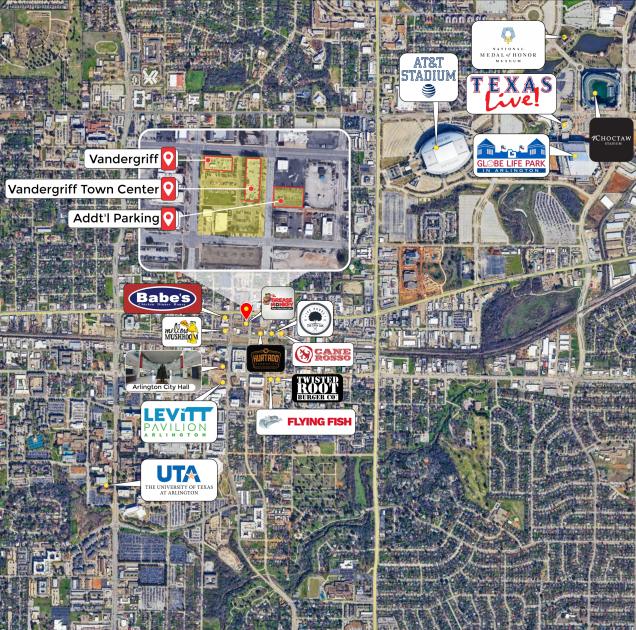
Retail Space
200 North Mesquite Street Arlington, TX 76011
200 North Mesquite Street Arlington, TX 76011
Details & Description
Property Highlights
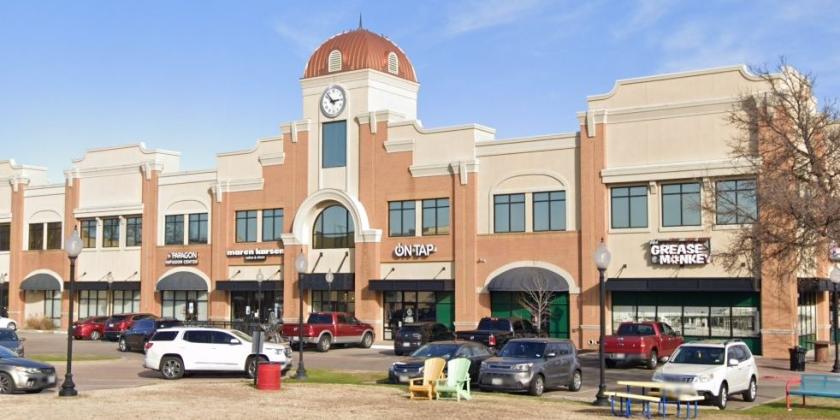
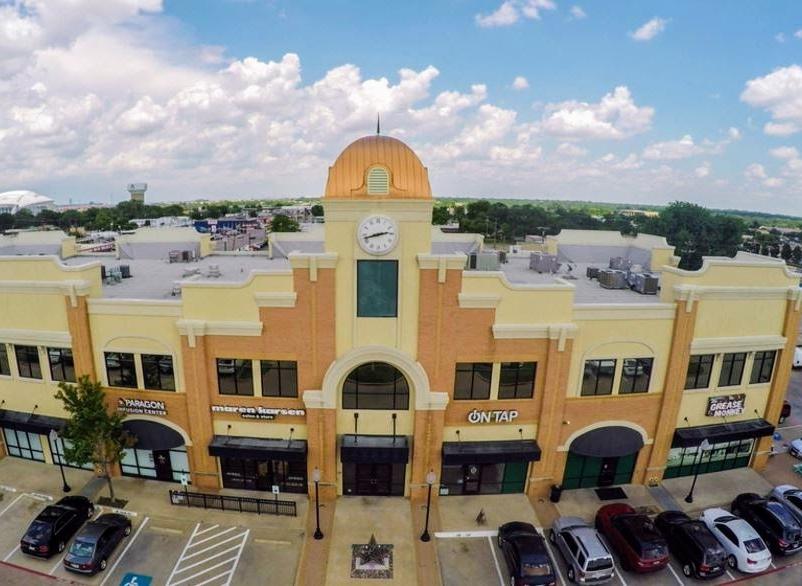
• Retail shop space in attractive mixed-use building with ground floor retail and professional offices above.
• Vibrant area with restaurants, retail and entertainment venues within walking distance.
Listing Agents

Renee Efimoff
O: 817-226-5000
M: 817-435-8345
renee@scmrealestate.com
O: 817-226-5000
M: 817-435-8345
renee@scmrealestate.com
While we strive to provide the most accurate information, all listing information, and demographic data, is provided by third-parties. As such, MyEListing will not be responsible for the accuracy of the information. It is strongly recommended that you verify all information with the listing agent, and any relevant agencies, prior to making any decisions.