Retail Space
141 East Willow Street Long Beach, CA 90806
141 East Willow Street Long Beach, CA 90806
Details & Description
Property Highlights
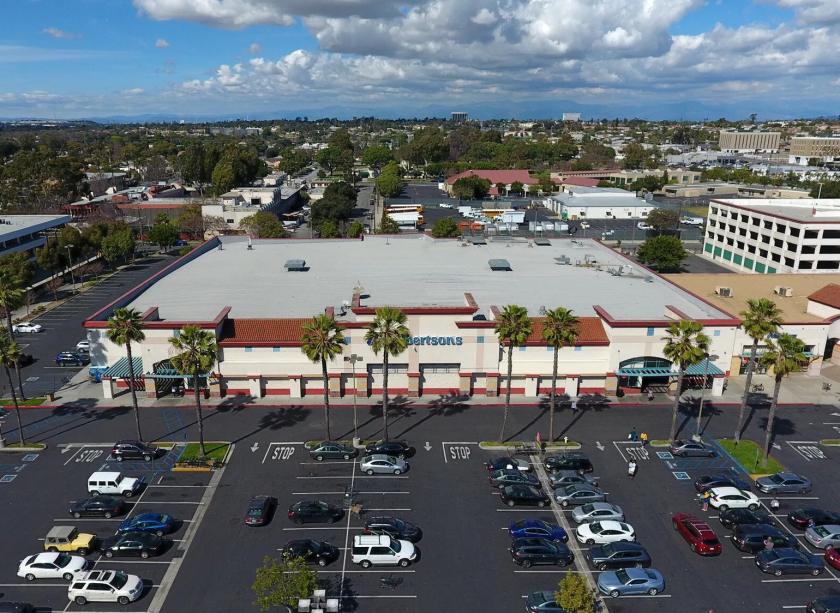
• A+ NATIONAL CO-TENANTS, INCLUDING STARBUCKS, RAINBOW SHOPS, WELLS FARGO, T-MOBILE, RENT-A-CENTER, CARL'S JR + PAP
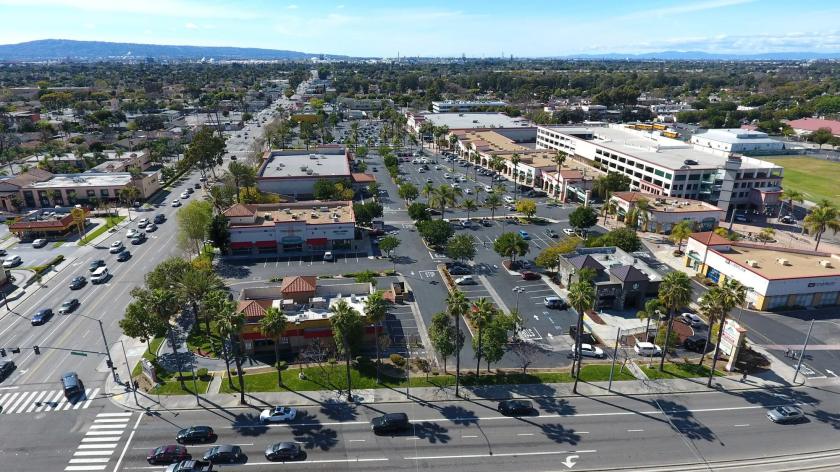
• NWC LONG BEACH BOULEVARD + WILLOW STREET- AVERAGE DAILY TRAFFIC: APPROX. 58,475 CARS PER DAY
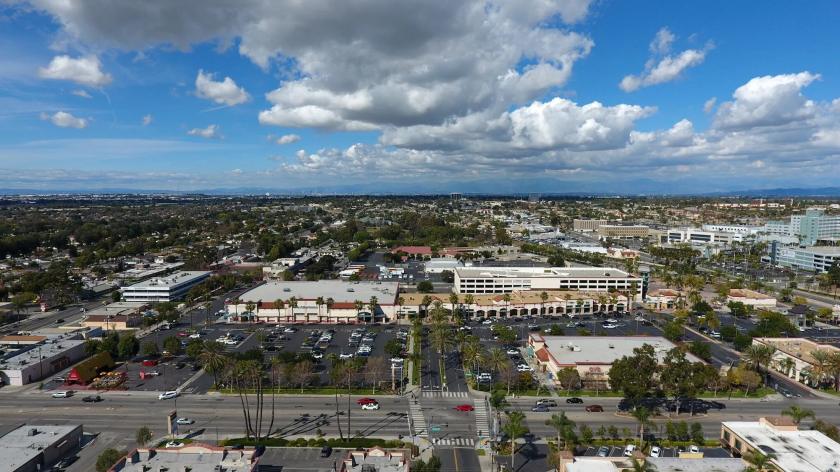
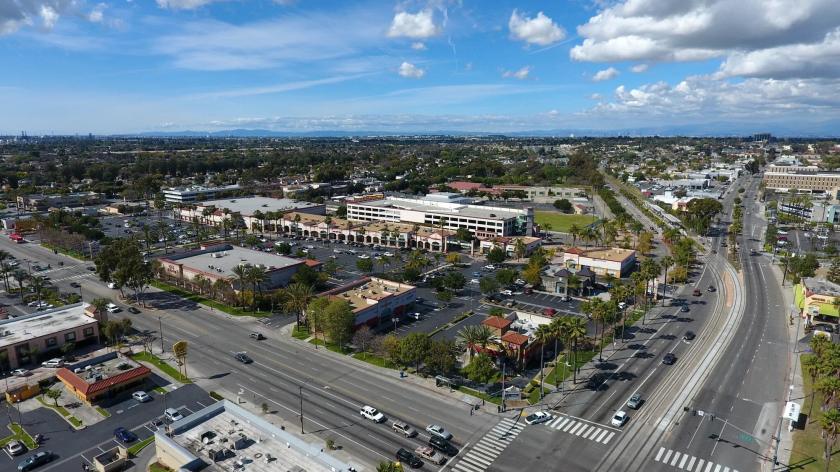
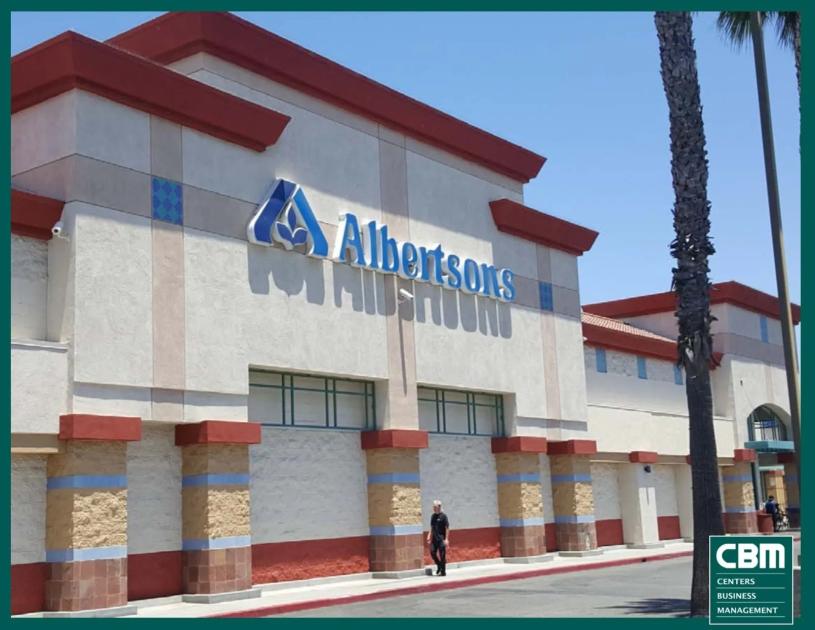
Additional Photos
Listing Agents

Geoffrey Grossman
M: 310-299-4224
geoff@cbm1.com
M: 310-299-4224
geoff@cbm1.com

Jason Ehrenpreis
M: 310-231-5213
jason@cbm1.com
M: 310-231-5213
jason@cbm1.com
While we strive to provide the most accurate information, all listing information, and demographic data, is provided by third-parties. As such, MyEListing will not be responsible for the accuracy of the information. It is strongly recommended that you verify all information with the listing agent, and any relevant agencies, prior to making any decisions.


