Specialty Real Estate
13951 Indian Woods San Antonio, TX 78249
13951 Indian Woods San Antonio, TX 78249

Details & Description
Property Highlights
• Spacious design with ample space and high ceilings providing room to store vehicles, tools, equipment
• Highly desirable location within close proximity to I-10, Loop 1604, and City of Shavano Park
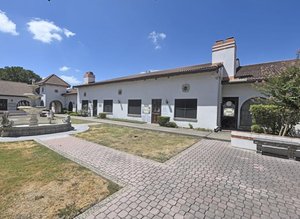
Additional Photos


Listing Agents

Gilles Ghez
O: 210-222-2424
M: 210-872-4382
gghez@dhrp.us
O: 210-222-2424
M: 210-872-4382
gghez@dhrp.us

Kim Ghez
O: 210-222-2424
M: 210-867-0004
kghez@dhrp.us
O: 210-222-2424
M: 210-867-0004
kghez@dhrp.us
While we strive to provide the most accurate information, all listing information, and demographic data, is provided by third-parties. As such, MyEListing will not be responsible for the accuracy of the information. It is strongly recommended that you verify all information with the listing agent, and any relevant agencies, prior to making any decisions.