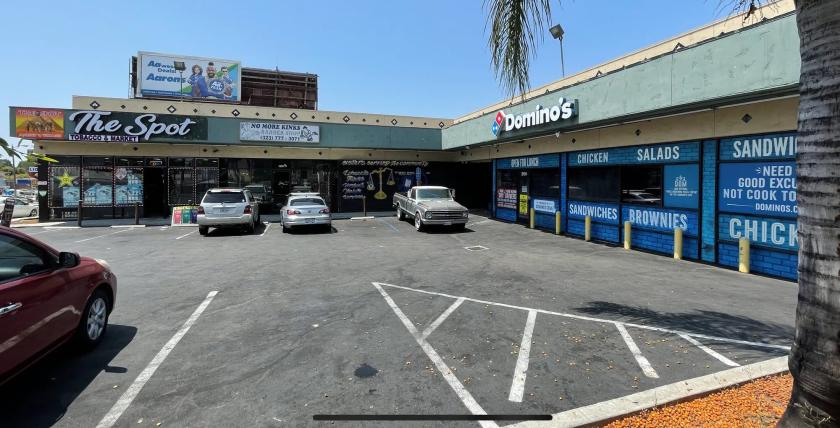
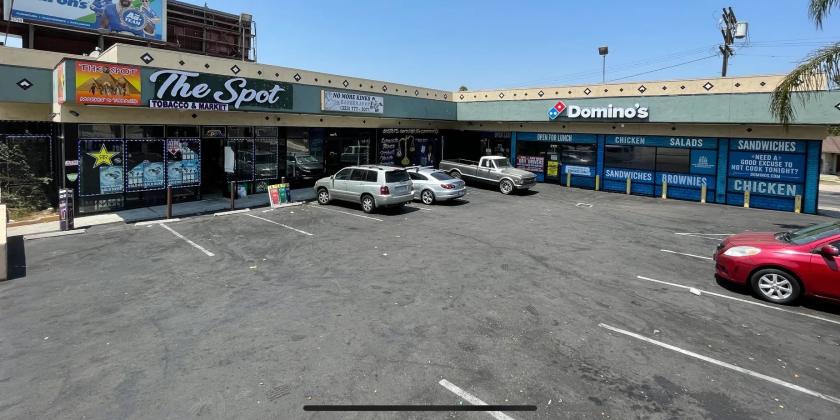
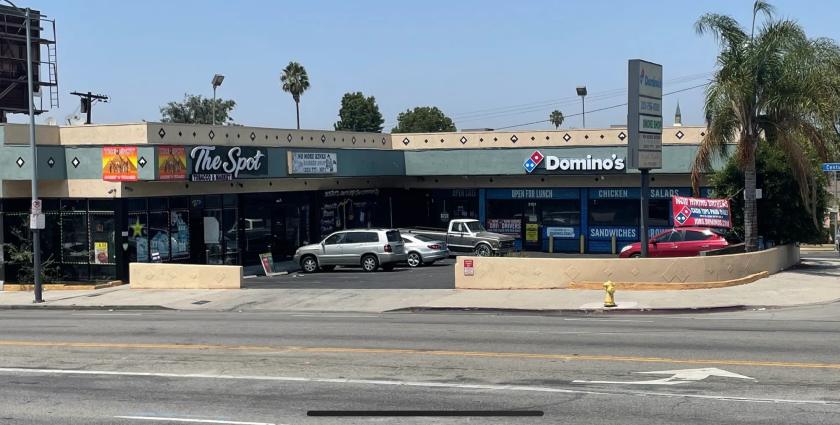
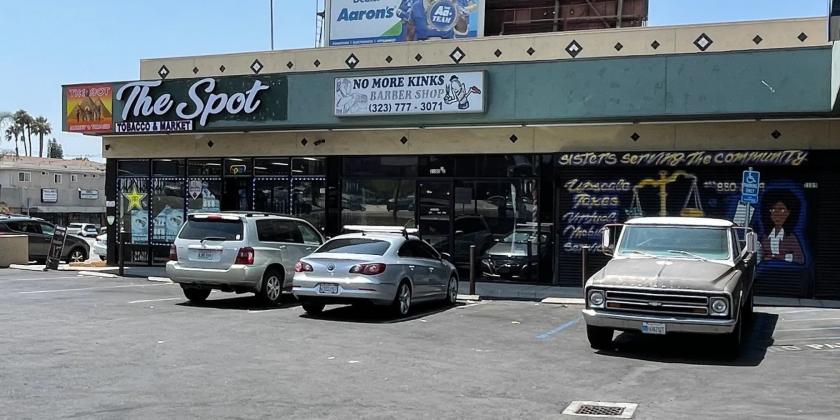
Retail Space
2101-2107 W Century Blvd Los Angeles, CA 90047
2101-2107 W Century Blvd Los Angeles, CA 90047
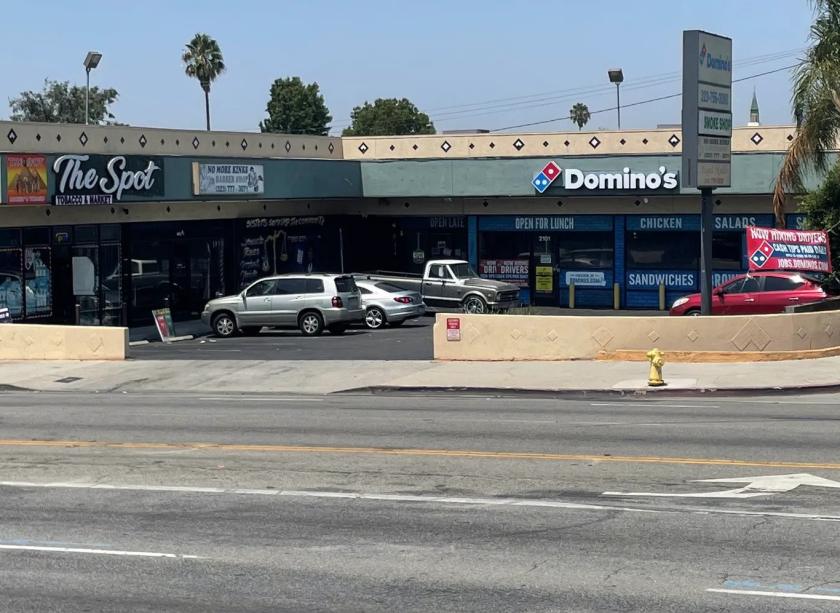
Details & Description
Property Highlights
- • Great visibility and easy access to parking lot
- • Pylon signage available
- • High traffic count at over 33,000 CPD
Additional Photos

Listing Agents

Geoffrey Grossman
M: 310-299-4224
geoff@cbm1.com
M: 310-299-4224
geoff@cbm1.com
While we strive to provide the most accurate information, all listing information, and demographic data, is provided by third-parties. As such, MyEListing will not be responsible for the accuracy of the information. It is strongly recommended that you verify all information with the listing agent, and any relevant agencies, prior to making any decisions.