Retail Space
6313 North President George Bush Highway Garland, TX 75044
6313 North President George Bush Highway Garland, TX 75044
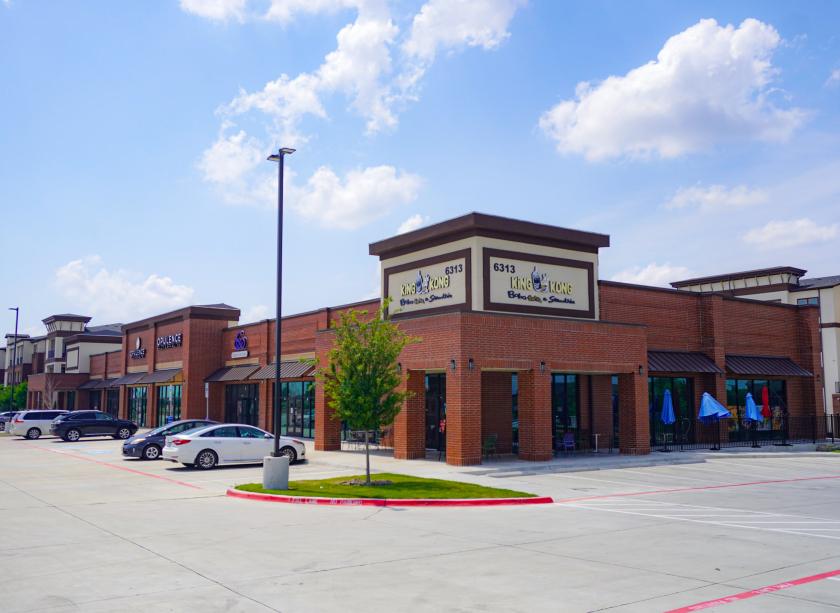
Details & Description
Property Highlights
• Adjacent to Berkshire Development - 936+ luxury apartments
• Brand new construction built Q4 2021
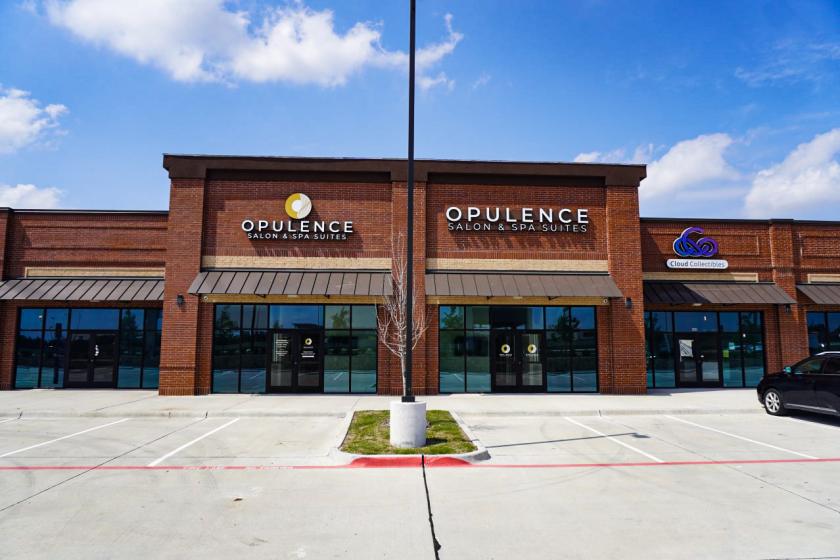
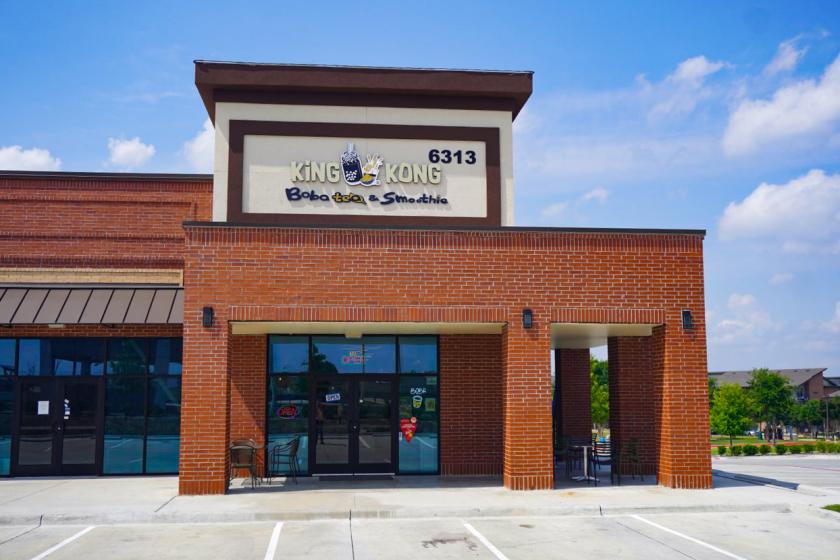
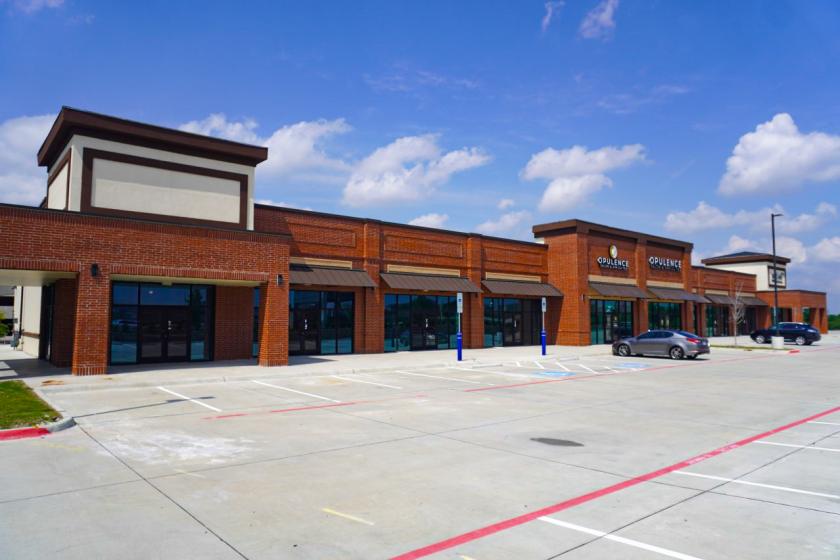
Additional Photos

Listing Agents

Jeremy Cummings
O: 214-466-1544
M: 214-636-2549
jeremy@structurecommercial.com
O: 214-466-1544
M: 214-636-2549
jeremy@structurecommercial.com
While we strive to provide the most accurate information, all listing information, and demographic data, is provided by third-parties. As such, MyEListing will not be responsible for the accuracy of the information. It is strongly recommended that you verify all information with the listing agent, and any relevant agencies, prior to making any decisions.


