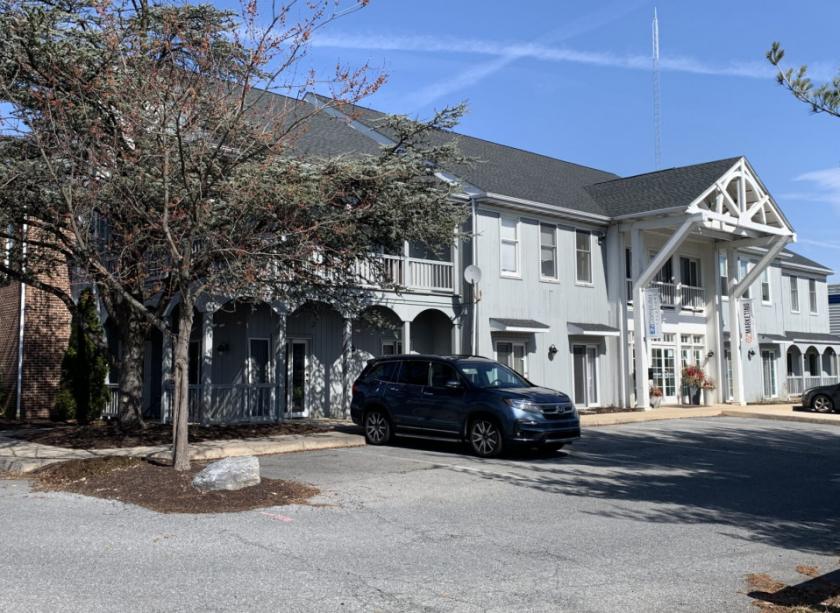
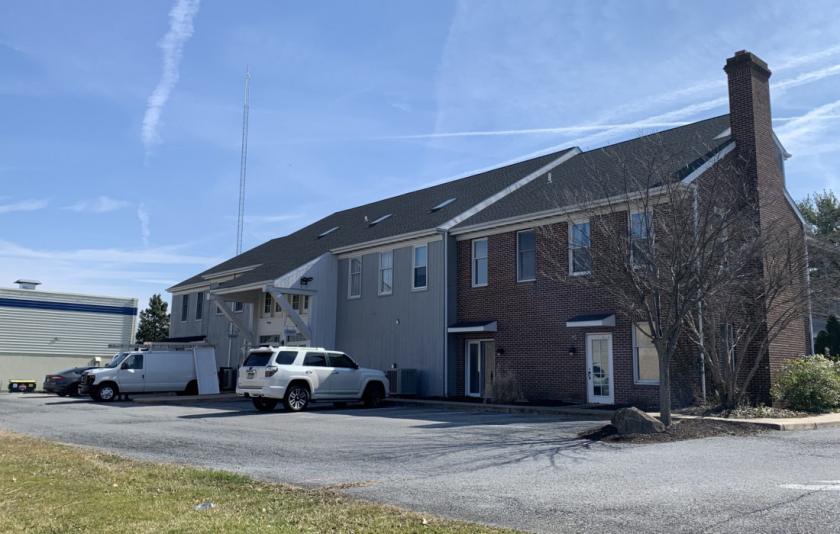
Office Space
111 Centerville Road Lancaster, PA 17603
111 Centerville Road Lancaster, PA 17603
Details & Description
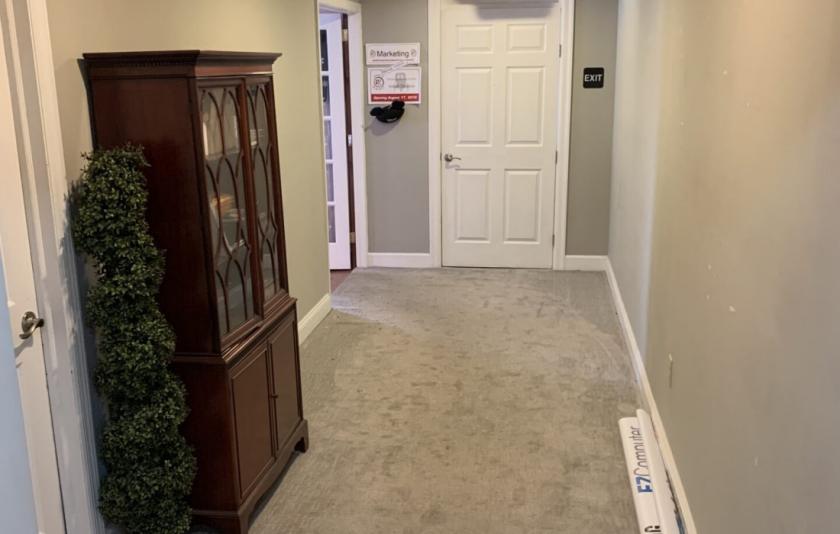
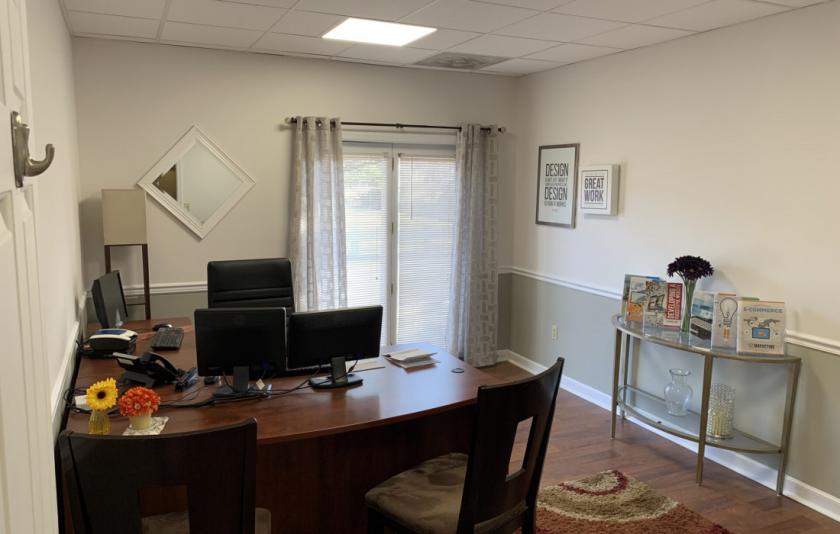
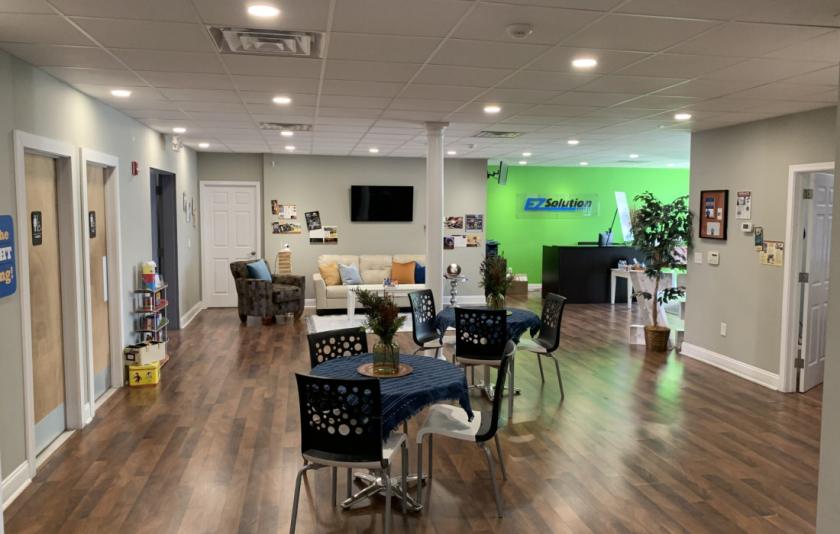
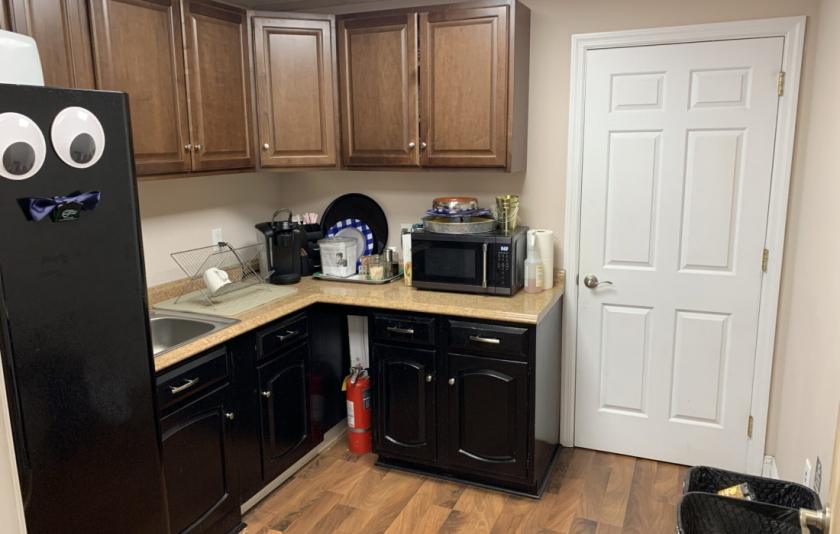
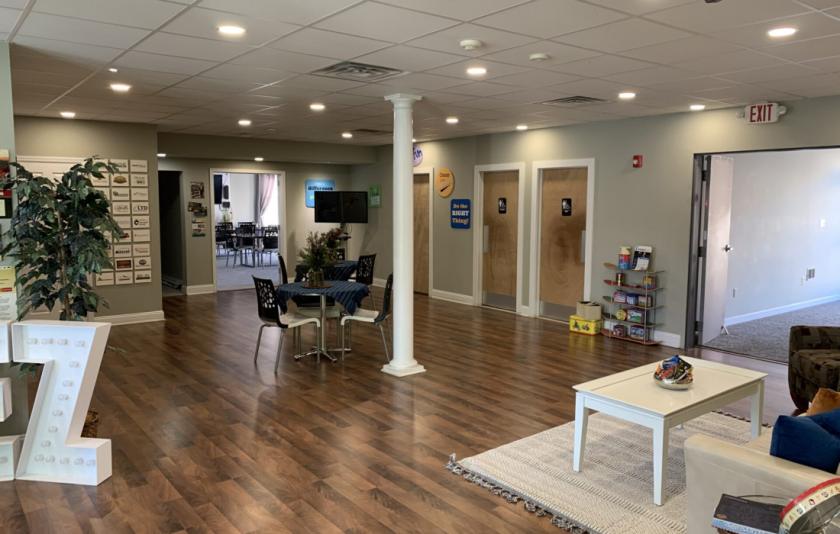
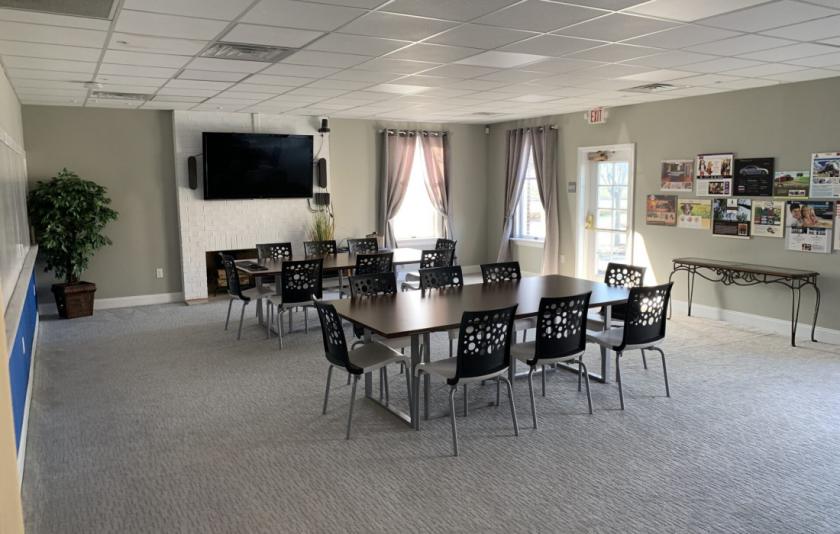
Additional Photos
Listing Agents

Tom Troccoli
O: 717-843-5555
ttroccoli@bennettwilliams.com
O: 717-843-5555
ttroccoli@bennettwilliams.com
While we strive to provide the most accurate information, all listing information, and demographic data, is provided by third-parties. As such, MyEListing will not be responsible for the accuracy of the information. It is strongly recommended that you verify all information with the listing agent, and any relevant agencies, prior to making any decisions.