District: 100 Land Class: FV FARM VACANT FLORENCE SC29503
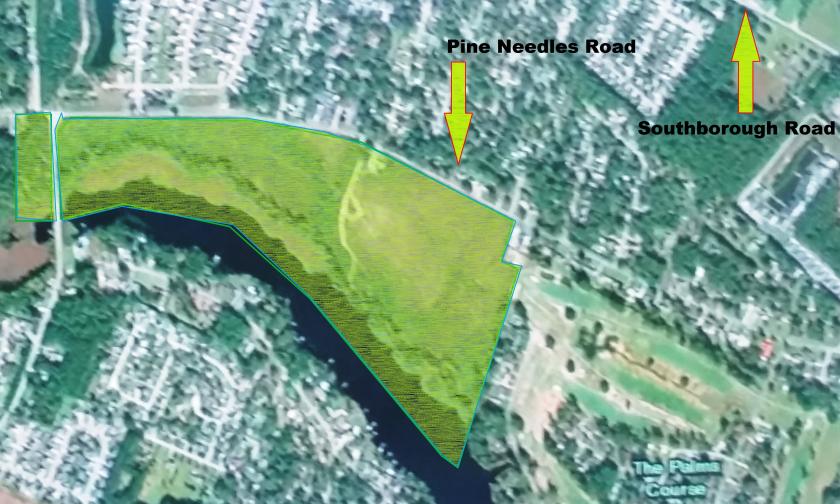
Legal Desc: OFF HWY 577
Land Characteristic Selections
01 Topography 1 Level
02 Street 1 Paved
03 Utilities 8 Electricity
04 Fronting Traffic 3 Light
05 Ownership 1 Private
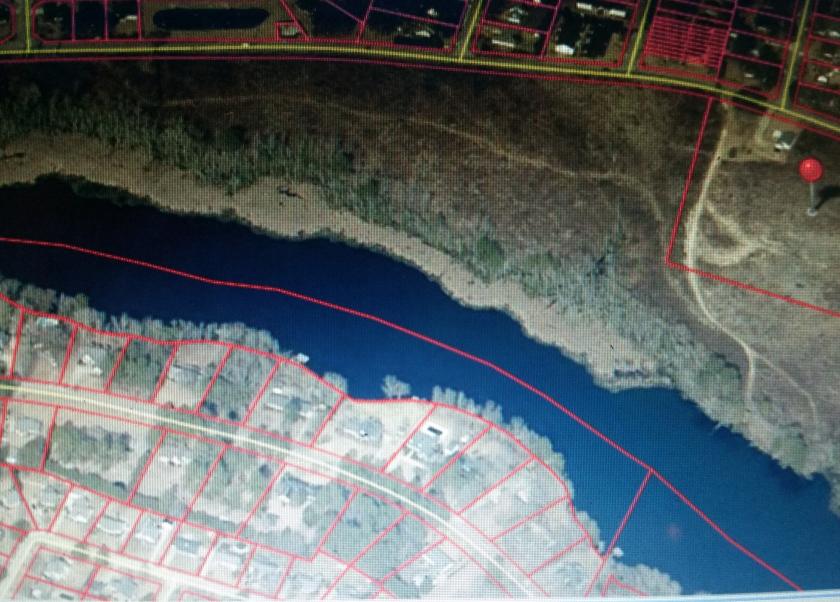
Acres: Tillable 41.29
Acres: Woodland 45.94
LAND USE ACRES Timber: 40.78 Cleared: 46.45 4 %: .00 6 %: .00 Total: 87.23
--- Totals for MBP ---
# Buildings: 0 Building Value: .00 Land Market Value: 697,840.00
Market Acres: 87.23 Use Acres: 87.23 Land Use Value: 10,060.81
Bld/Land Use Total: 10,060.81 Bld/Land Mar.Total: 697,840.00 6% Bld Value: 0 # of 6% Blds: 0
Rental Acres: 0 Rental Acres Value: 0 Ren.Acres-Mar: 0 Ren.Acres Value-Mar: 0
No part of this information may be copied, reproduced, repurposed, or screen-captured for any commercial purpose without prior written authorization from MyEListing.
While we strive to provide the most accurate information, all listing information, and demographic data, is provided by third-parties. As such, MyEListing will not be responsible for the accuracy of the information. It is strongly recommended that you verify all information with the listing agent, and any relevant agencies, prior to making any decisions.
How much land does the Florence, SC property at Highway 577 include?
Highway 577 in Florence includes 82.000 acres of land
What kind of Land is the propery at Highway 577?
The property at Highway 577 Florence, SC 29501 is listed as a Single Family Land Land property
What is the population within 1 mile of Highway 577 in Florence?
The population within 1 mile of Highway 577 Florence, SC 29501 is 4,552 people.
Who do I contact for questions about Highway 577?
You should contact the listing agent,
Nathaniel Poston, for any details regarding this commercial listing.