Triple Net Lease
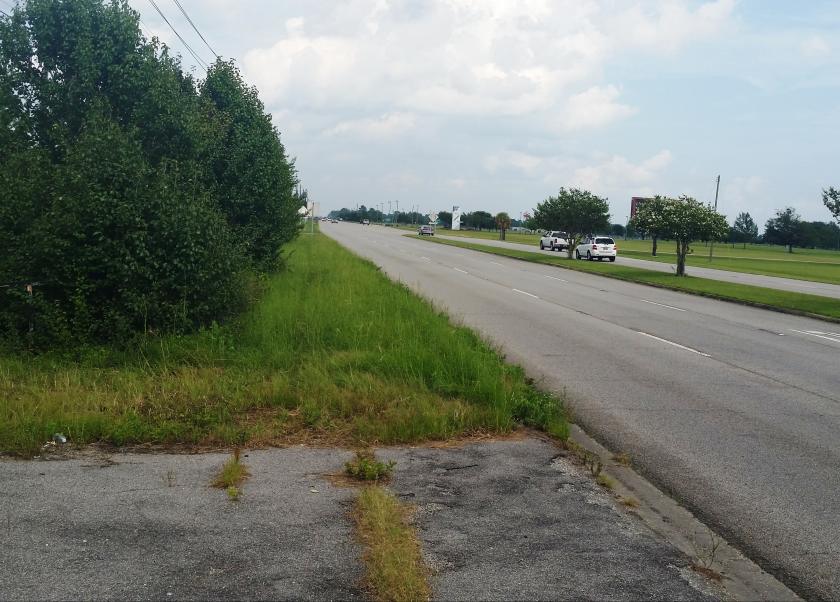
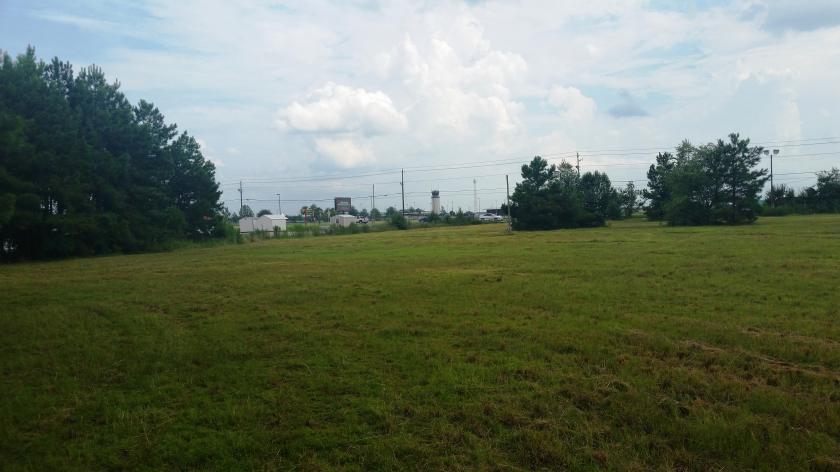
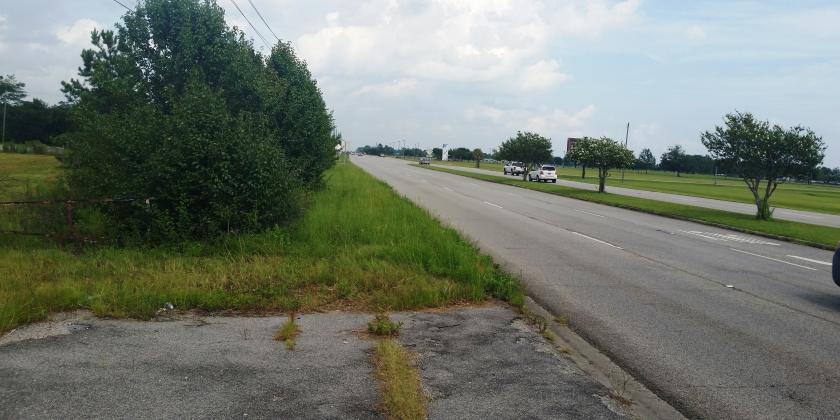
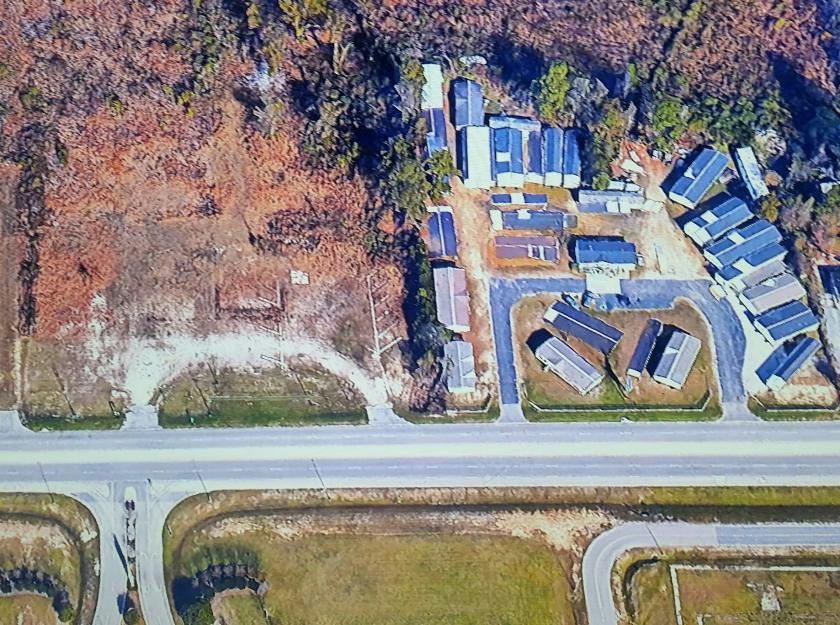
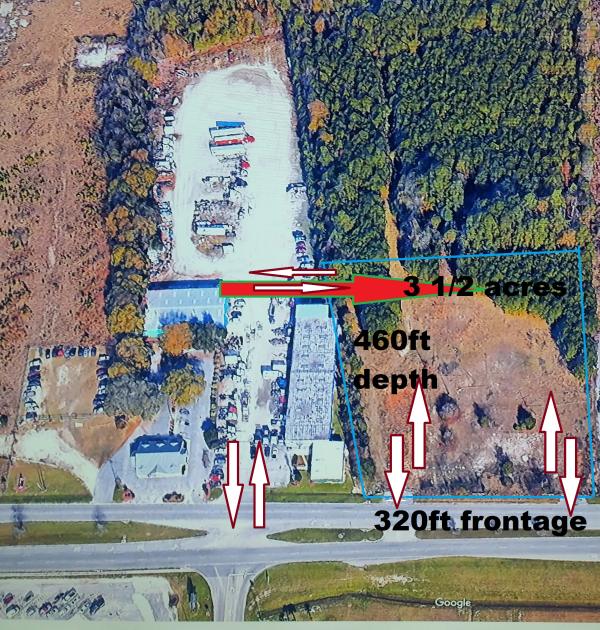
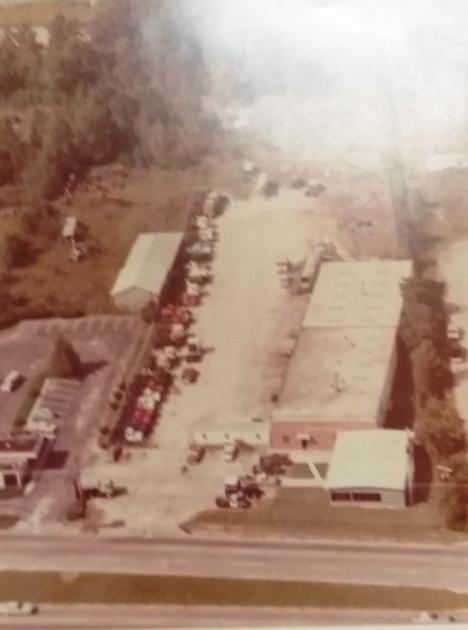
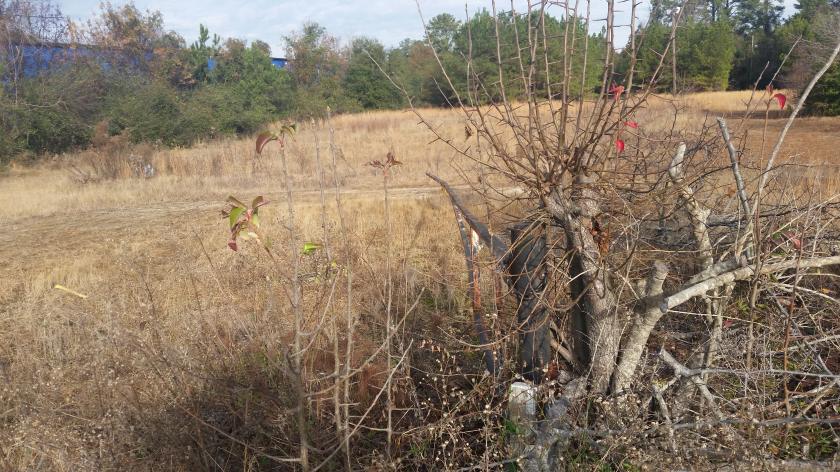
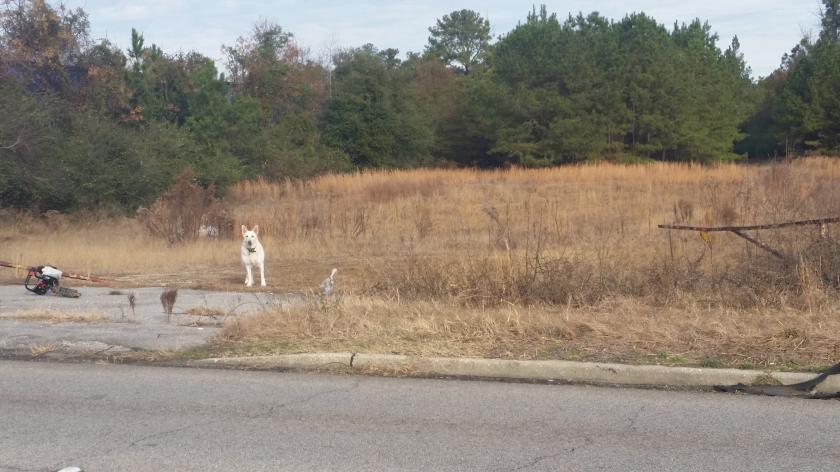
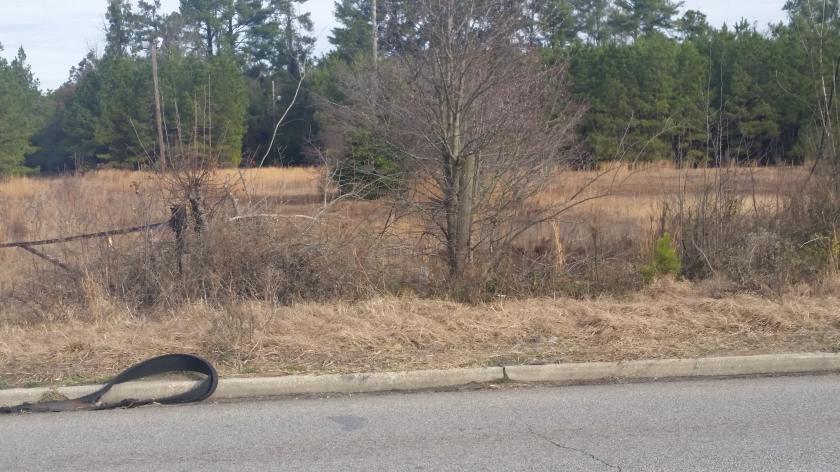
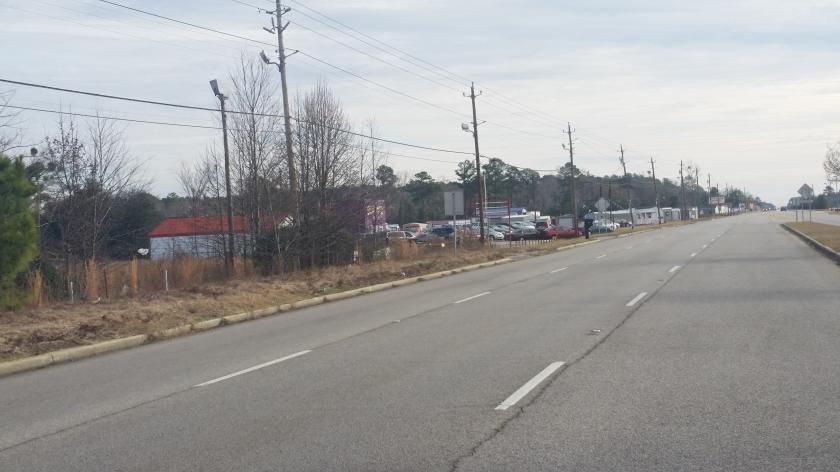
Large open tillable and clear acreage off Highway 76 direct route to Myrtle Beach
Located IN County; not subject to City Business Tax
Access to County Utilites
Unzoned property with CSX Rail line in Rear on Northern most border and Southern Most Border with Regional Airport
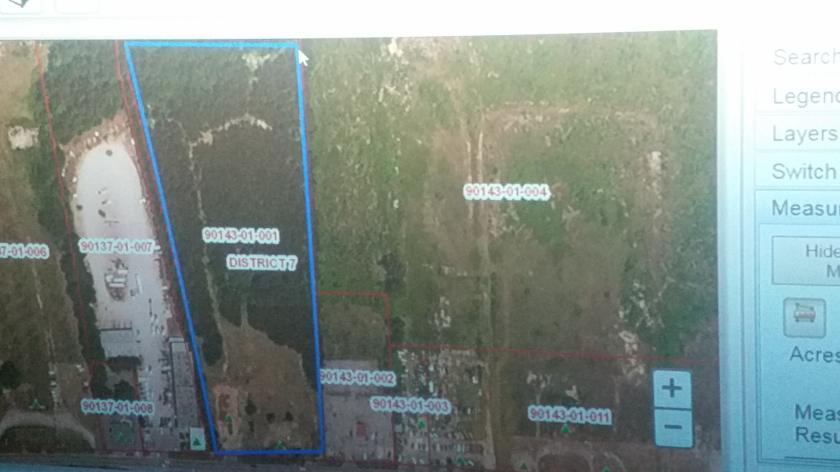
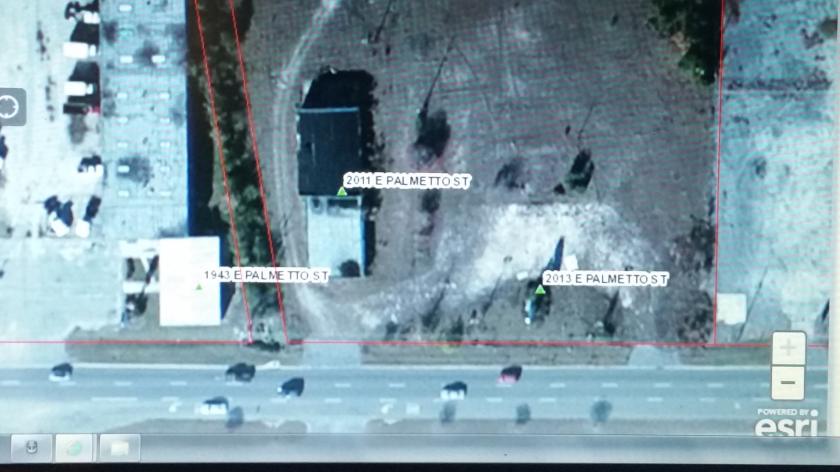
90143-01-001 90137-01-007
County of Florence, State of North Carolina
Owner Name: POSTON RONALD B & Mailing Address: POSTON WILLIAM S PO BOX 1585 FLORENCE SC29503
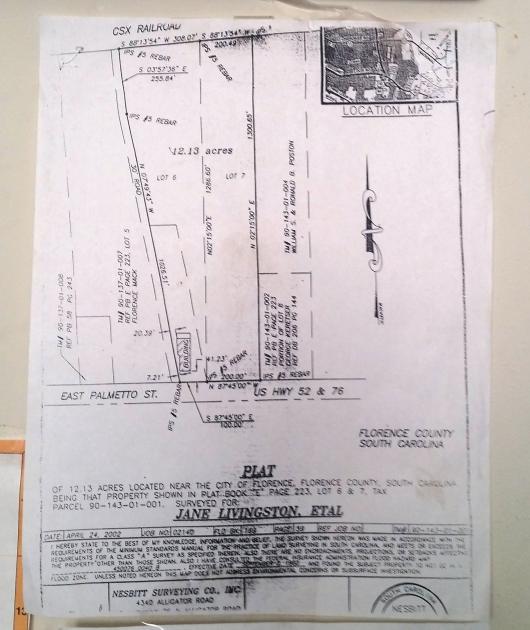
Calculated Acreage: 12.60
Address Site: 2011 E PALMETTO ST;2013 E PALMETTO ST
Municipality: FLORENCE COUNTY
Zoning: UNZONED
Fire District: WINDY HILL
County Council District: DISTRICT 7
Flood Panel: 45041C0153E
***IMPORTANT NOTE*** THIS DATA IS FOR REFERENCE USE ONLY. FLORENCE COUNTY IS NOT LIABLE FOR ANY DAMAGES CAUSED BY THE USE OF THIS DATA. A DISTRICT OR OTHER BOUNDARY LINE MAY CAUSE PARCEL DATA TO DIFFER BASED ON HOW MUCH OF THAT PARCEL RESTS IN A DISTRICT OR ON A BOUNDARY. REFER TO LEGAL OR ORIGINAL DOCUMENTATION TO DETERMINE THE ACCURACY OF THE DATA
No part of this information may be copied, reproduced, repurposed, or screen-captured for any commercial purpose without prior written authorization from MyEListing.
While we strive to provide the most accurate information, all listing information, and demographic data, is provided by third-parties. As such, MyEListing will not be responsible for the accuracy of the information. It is strongly recommended that you verify all information with the listing agent, and any relevant agencies, prior to making any decisions.
How much land does the Florence, SC property at 2011 East Palmetto Street include?
2011 East Palmetto Street in Florence includes 12.000 acres of land
What kind of Land is the propery at 2011 East Palmetto Street?
The property at 2011 East Palmetto Street Florence, SC 29506 is listed as a Office Land Land property
What is the population within 1 mile of 2011 East Palmetto Street in Florence?
The population within 1 mile of 2011 East Palmetto Street Florence, SC 29506 is 1,500 people.
Who do I contact for questions about 2011 East Palmetto Street?
You should contact the listing agent,
Nathaniel Poston, for any details regarding this commercial listing.