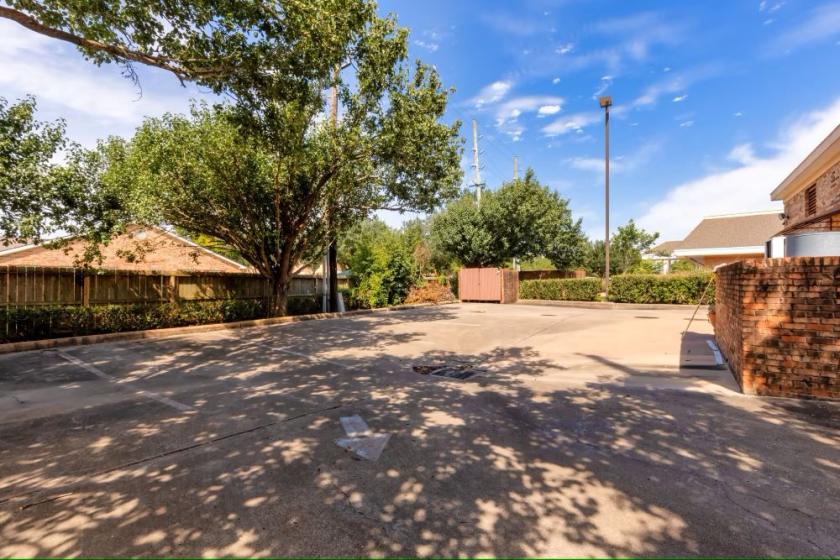
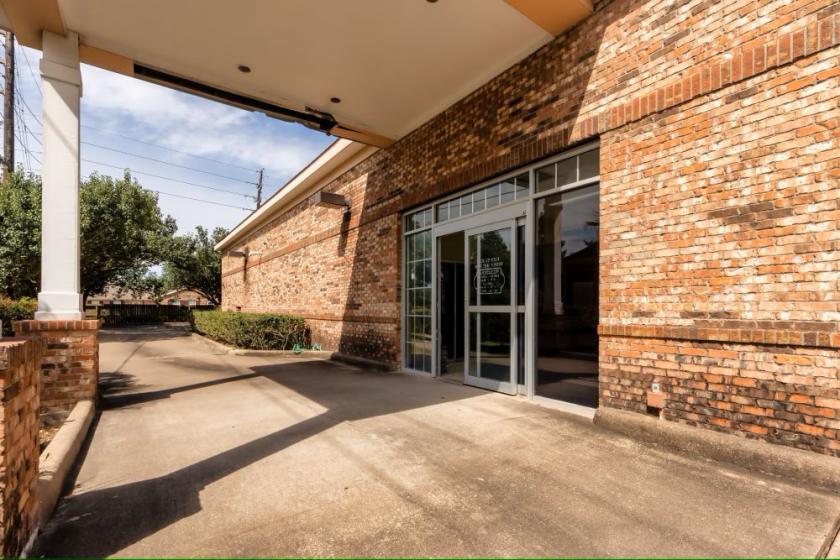
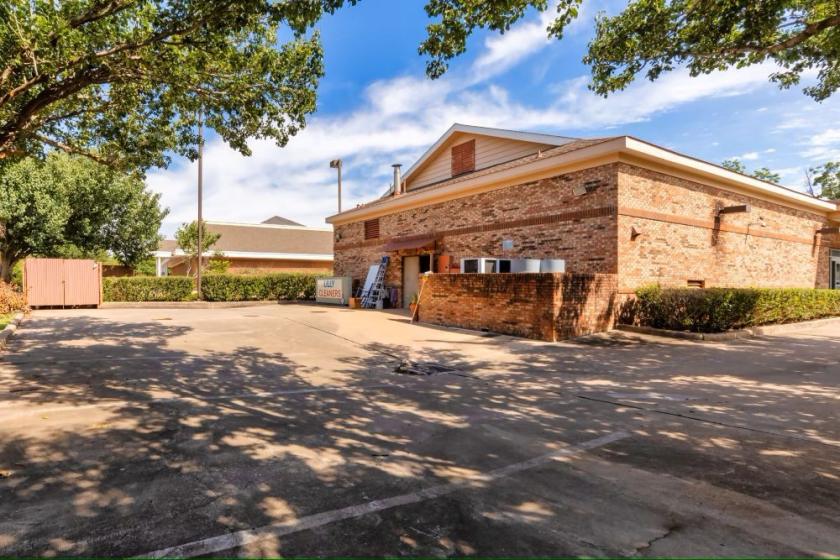
1-Mile | 3-Miles | 5-Miles | ||
---|---|---|---|---|
Total Population | 7,840 | 77,022 | 225,433 | |
Population Median Age | 42 | 40 | 38 | |
Population by Age | 0-9 Yrs | 716 (9%) | 8008 (10%) | 27936 (12%) |
10-19 Yrs | 1106 (14%) | 10298 (13%) | 30743 (13%) | |
20-29 Yrs | 819 (10%) | 9941 (12%) | 30915 (13%) | |
30-39 Yrs | 878 (11%) | 8782 (11%) | 27855 (12%) | |
40-49 Yrs | 1454 (18%) | 11312 (14%) | 31897 (14%) | |
50-59 Yrs | 702 (8%) | 9962 (12%) | 30686 (13%) | |
60-69 Yrs | 1206 (15%) | 10864 (14%) | 27382 (12%) | |
70+ Yrs | 960 (12%) | 7856 (10%) | 18017 (7%) | |
Median HH Income | $97,678 | $119,090 | $99,391 | |
Total Household Income | < 24K | 289 (10%) | 2082 (8%) | 6554 (9%) |
25-49K | 496 (17%) | 2992 (11%) | 9889 (13%) | |
50-74K | 389 (13%) | 3298 (12%) | 10940 (15%) | |
75-99K | 297 (10%) | 2697 (10%) | 8779 (12%) | |
100-199K | 730 (25%) | 8145 (31%) | 22756 (31%) | |
200K+ | 684 (23%) | 6533 (25%) | 12980 (18%) | |
Highest Education Level | No Diploma | 328 | 3141 | 13389 |
Diploma or GED | 1066 | 7376 | 24303 | |
Some College | 653 | 8128 | 25128 | |
Assoc. Degree | 324 | 3457 | 10420 | |
Bachelors Degree | 1737 | 17273 | 46316 | |
Higher Degree | 1577 | 14632 | 32008 | |
Total Housing Units | 3,130 | 26,997 | 75,265 | |
--Owner-Occupied | 1,726 | 19,486 | 52,287 | |
--Renter-Occupied | 1,159 | 6,261 | 19,611 | |
Owner-Occupied Values | < 100K | 12 | 397 | 2158 |
100-199K | 200 | 2053 | 9515 | |
200-299K | 203 | 4700 | 15677 | |
300-399K | 340 | 4556 | 11162 | |
400-499K | 312 | 3289 | 6550 | |
500K+ | 659 | 4491 | 7225 | |
Total Working Age Population | 6,434 | 62,534 | 178,453 | |
In Work Force | 3,879 | 40,086 | 117,715 | |
Not In Work Force | 2,554 | 22,448 | 60,738 | |
Workforce Employed | 3,678 | 38,182 | 111,158 | |
Workforce Unemployed | 202 | 1,874 | 6,490 | |
Civlian Workforce | 3,879 | 40,056 | 117,649 | |
Military Workforce | 0 | 30 | 66 | |
Total Households | 2,884 | 25,747 | 71,898 | |
Family Households | 2,007 | 20,261 | 57,396 | |
Non-Family Households | 878 | 5,486 | 14,502 | |
Married Couple | 1,693 | 17,232 | 46,712 | |
Other Family | 314 | 3,029 | 10,685 | |
Married w/Child | 731 | 7,385 | 21,263 | |
Single Male w/Child | 0 | 129 | 855 | |
Single Female w/Child | 142 | 947 | 4,115 |
Population Change Last Two Decades - Plus Projection
2000 | % | 2010 | % | 2020 | % | 2030 | |
---|---|---|---|---|---|---|---|
Texas | 20,851,820 | +21 | 25,145,561 | +18 | 29,677,668 | +18 | 34,894,452 |
Fort Bend County | 354,452 | +65 | 585,375 | +44 | 840,383 | +43 | 1,203,029 |
Harris County | 3,400,578 | +20 | 4,092,459 | +22 | 4,978,845 | +19 | 5,924,750 |
Total Working Age Population:
Total Households:
Total Working Age Population:
Total Households:
Total Working Age Population:
Total Households: