Office Space
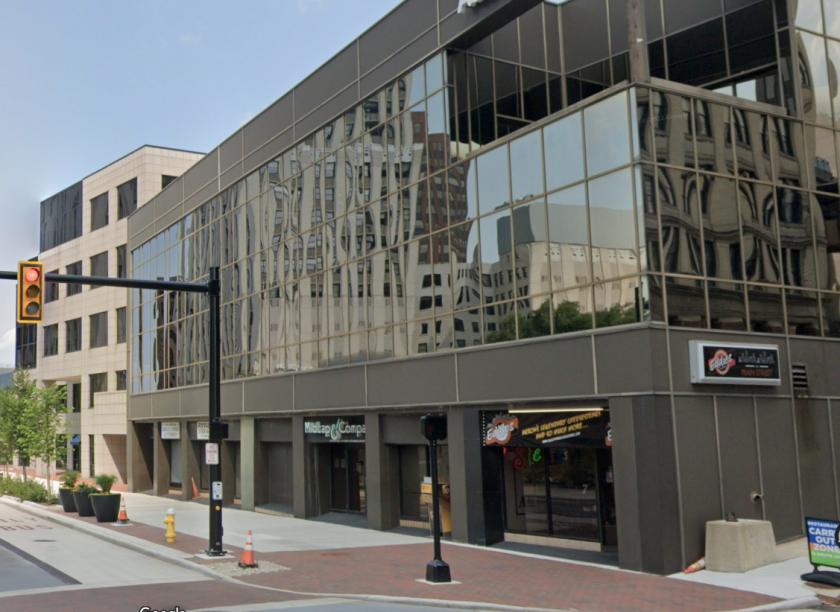
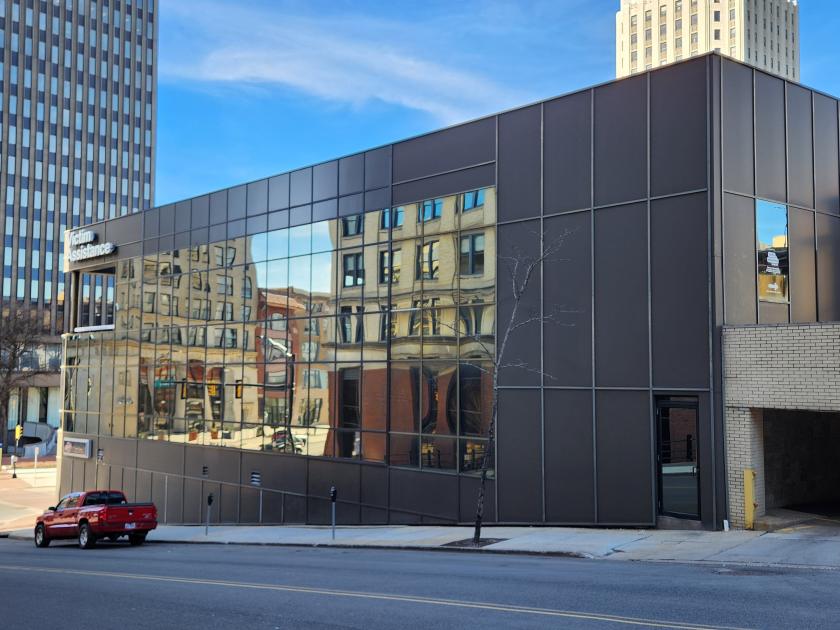
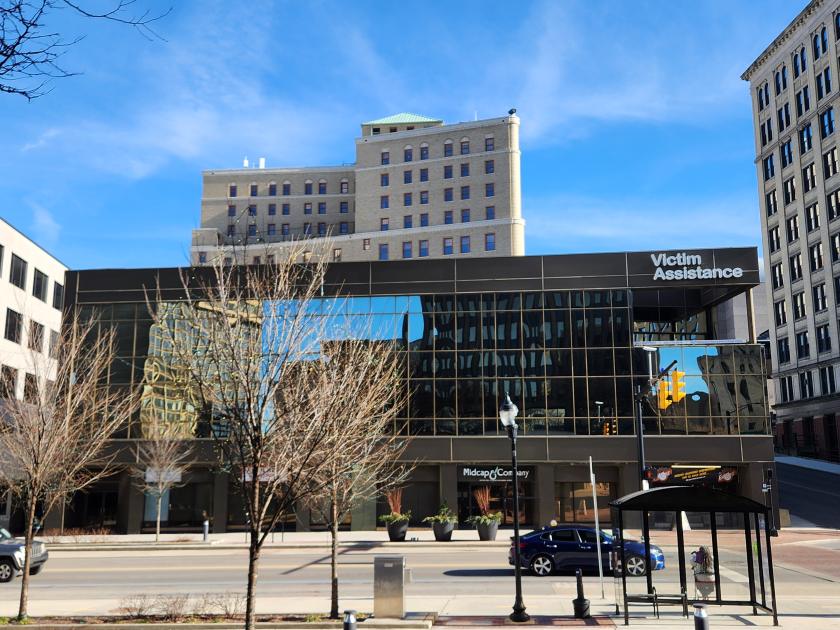
137 South Main Street Akron, OH 44308
137 South Main Street Akron, OH 44308
Details & Description
Property Highlights
• Suite 100 - 7,000 SF - great retail space
• Suite 202 - 3,500 SF
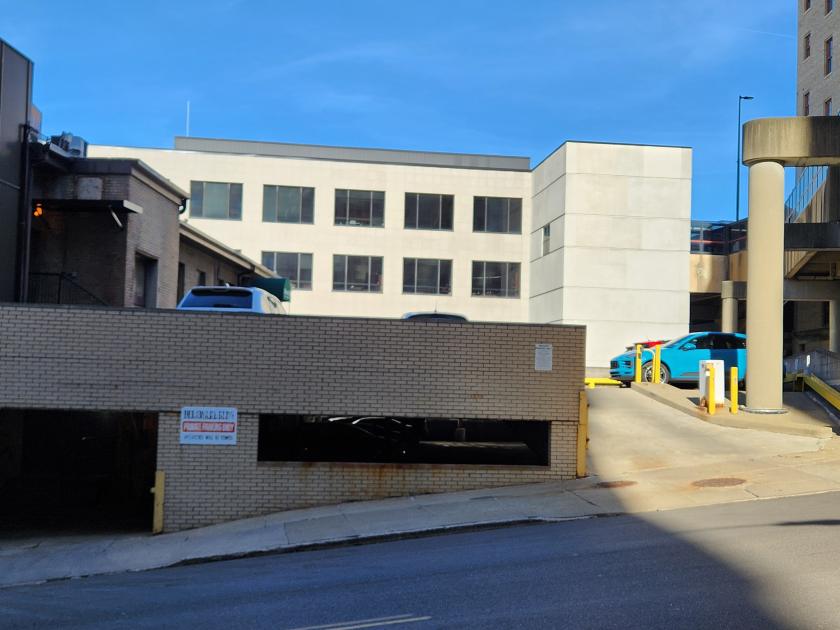
Additional Photos
Listing Agents

Ron Midcap II
O: 216-455-0900
M: 330-671-7767
rmidcap@naipvc.com
O: 216-455-0900
M: 330-671-7767
rmidcap@naipvc.com
While we strive to provide the most accurate information, all listing information, and demographic data, is provided by third-parties. As such, MyEListing will not be responsible for the accuracy of the information. It is strongly recommended that you verify all information with the listing agent, and any relevant agencies, prior to making any decisions.


