Retail Space
3202 Hardy Street Houston, TX 77009
3202 Hardy Street Houston, TX 77009
Details & Description
Property Highlights
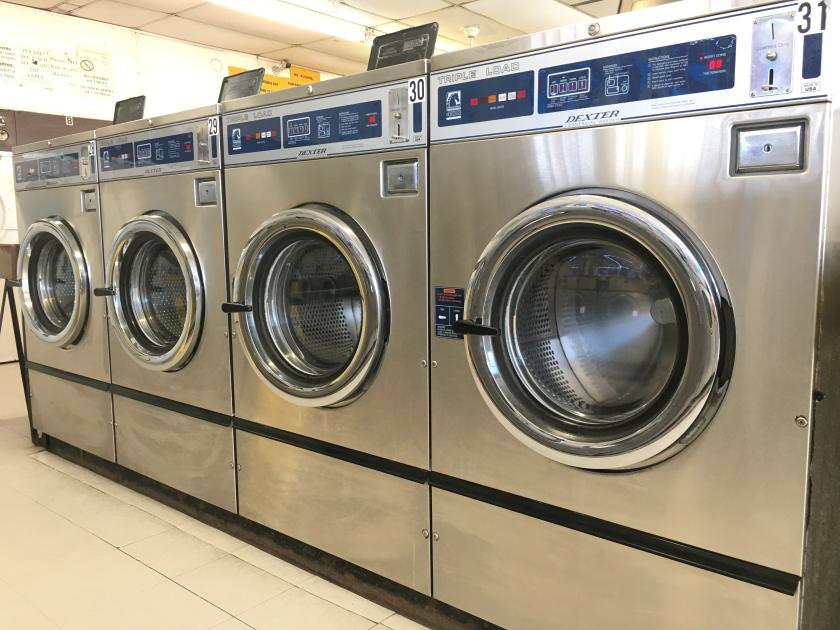
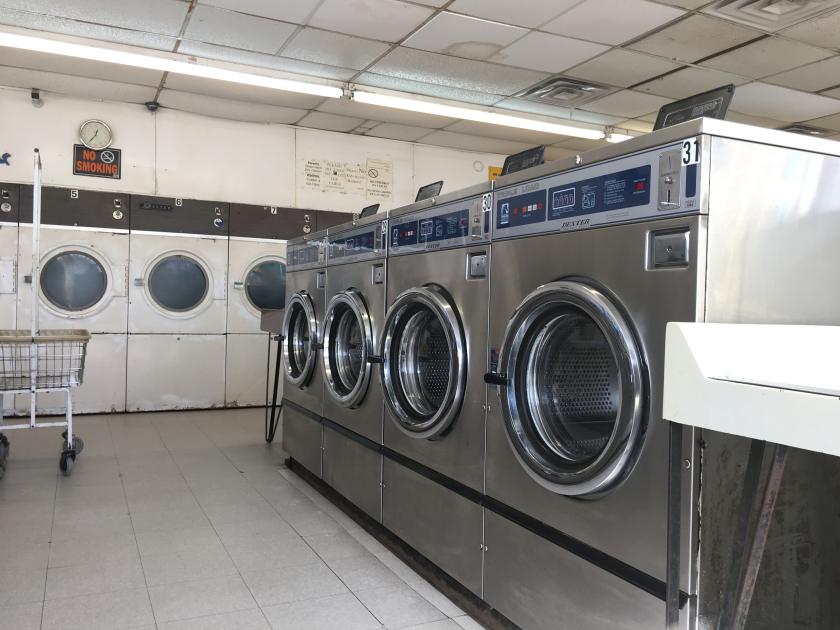
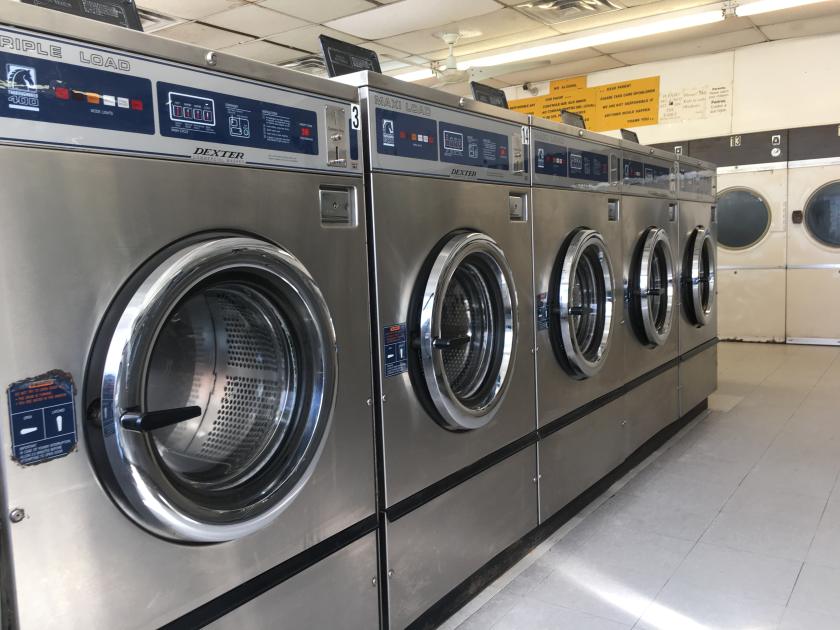
- • The space has an operating washateria/laundromat.
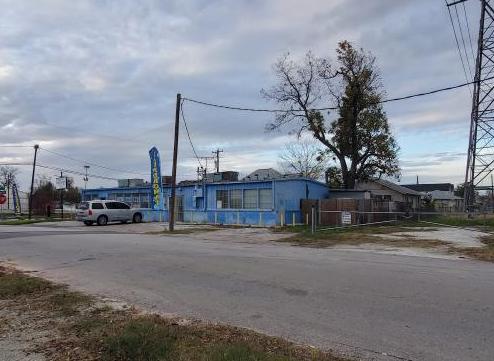
- • Minutes from Downtown Houston
- • Northside Inner Loop
Additional Photos


Listing Agents

Venture Realty
O: 281-685-5417
michael@venturerealtyrei.com
O: 281-685-5417
michael@venturerealtyrei.com
While we strive to provide the most accurate information, all listing information, and demographic data, is provided by third-parties. As such, MyEListing will not be responsible for the accuracy of the information. It is strongly recommended that you verify all information with the listing agent, and any relevant agencies, prior to making any decisions.