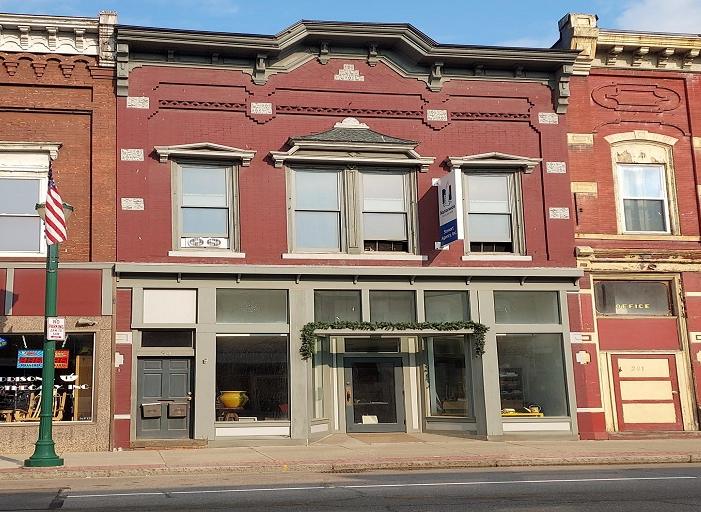
1-Mile | 3-Miles | 5-Miles | ||
---|---|---|---|---|
Total Population | 331 | 2,090 | 4,662 | |
Population Median Age | 38 | 38 | 39 | |
Population by Age | 0-9 Yrs | 48 (14%) | 275 (13%) | 566 (12%) |
10-19 Yrs | 53 (16%) | 325 (15%) | 680 (14%) | |
20-29 Yrs | 32 (9%) | 212 (10%) | 496 (10%) | |
30-39 Yrs | 53 (16%) | 293 (14%) | 586 (12%) | |
40-49 Yrs | 34 (10%) | 259 (12%) | 627 (13%) | |
50-59 Yrs | 44 (13%) | 285 (13%) | 677 (14%) | |
60-69 Yrs | 31 (9%) | 209 (10%) | 510 (10%) | |
70+ Yrs | 37 (11%) | 232 (11%) | 522 (11%) | |
Median HH Income | $47,529 | $57,432 | $64,750 | |
Total Household Income | < 24K | 35 (26%) | 179 (22%) | 321 (17%) |
25-49K | 33 (25%) | 194 (23%) | 421 (23%) | |
50-74K | 19 (14%) | 119 (14%) | 268 (14%) | |
75-99K | 22 (16%) | 136 (16%) | 276 (15%) | |
100-199K | 20 (15%) | 159 (19%) | 428 (23%) | |
200K+ | 1 (0%) | 24 (2%) | 90 (4%) | |
Highest Education Level | No Diploma | 26 | 162 | 352 |
Diploma or GED | 97 | 567 | 1193 | |
Some College | 35 | 217 | 476 | |
Assoc. Degree | 32 | 210 | 496 | |
Bachelors Degree | 16 | 115 | 289 | |
Higher Degree | 9 | 112 | 367 | |
Total Housing Units | 151 | 952 | 2,115 | |
--Owner-Occupied | 83 | 576 | 1,358 | |
--Renter-Occupied | 47 | 234 | 447 | |
Owner-Occupied Values | < 100K | 54 | 321 | 651 |
100-199K | 21 | 161 | 396 | |
200-299K | 5 | 66 | 216 | |
300-399K | 0 | 7 | 28 | |
400-499K | 0 | 8 | 32 | |
500K+ | 2 | 13 | 34 | |
Total Working Age Population | 252 | 1,633 | 3,737 | |
In Work Force | 150 | 983 | 2,276 | |
Not In Work Force | 102 | 650 | 1,460 | |
Workforce Employed | 140 | 913 | 2,106 | |
Workforce Unemployed | 9 | 68 | 167 | |
Civlian Workforce | 149 | 981 | 2,273 | |
Military Workforce | 0 | 2 | 4 | |
Total Households | 130 | 810 | 1,805 | |
Family Households | 81 | 546 | 1,284 | |
Non-Family Households | 49 | 265 | 521 | |
Married Couple | 62 | 428 | 1,020 | |
Other Family | 19 | 118 | 263 | |
Married w/Child | 26 | 184 | 432 | |
Single Male w/Child | 5 | 23 | 40 | |
Single Female w/Child | 9 | 47 | 86 |
Population Change Last Two Decades - Plus Projection
2000 | % | 2010 | % | 2020 | % | 2030 | |
---|---|---|---|---|---|---|---|
New York | 18,976,457 | +2 | 19,378,102 | +4 | 20,146,131 | +2 | 20,604,030 |
Steuben County | 98,726 | 0 | 98,990 | -4 | 95,343 | -4 | 91,632 |
Total Working Age Population:
Total Households:
Total Working Age Population:
Total Households:
Total Working Age Population:
Total Households: