Multifamily Housing
3360 Ewings Road Lockport, NY 14094
3360 Ewings Road Lockport, NY 14094
Details & Description
Property Highlights
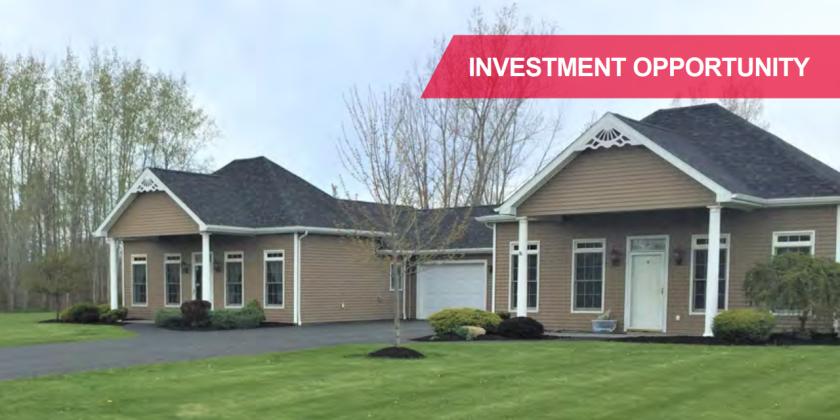
• 1,250 Sq. Ft. units featuring 2 bedrooms, 1 bathroom, 1 private attached garage, covered front porch, attached patio
• Open floor plan with high end features including fireplace, cathedral ceilings, gas/heat appliances
Listing Agents

Dillon T. Fitzgerald
O: 716-852-7500
M: 716-983-9153
dfitzgerald@pyramidbrokerage.com
O: 716-852-7500
M: 716-983-9153
dfitzgerald@pyramidbrokerage.com
While we strive to provide the most accurate information, all listing information, and demographic data, is provided by third-parties. As such, MyEListing will not be responsible for the accuracy of the information. It is strongly recommended that you verify all information with the listing agent, and any relevant agencies, prior to making any decisions.